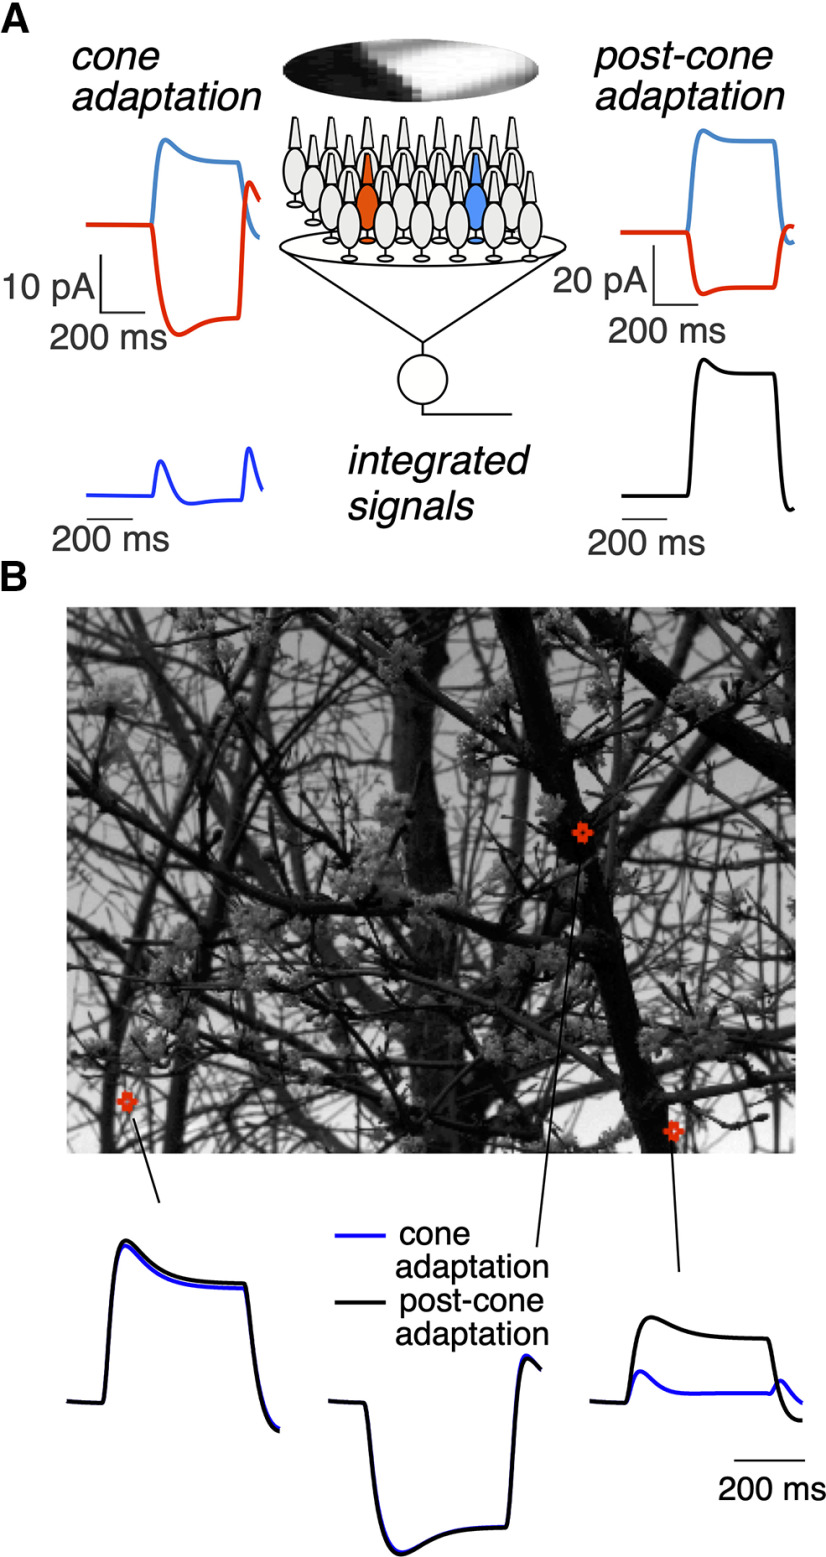
Figure 14.
Local cone adaptation shapes integrated responses to spatially structured inputs. A, Top, Examples of predicted responses of two cones to a flashed natural image. Left, Predicted responses from the biophysical model. Right, Predicted responses for a linear cone model. Bottom, Sum of the responses across a collection of cones to illustrate the impact of signal integration, for example, integration within the receptive field of a downstream neuron. Cones were weighted with a Gaussian spatial profile resembling the receptive field of a primate Parasol retinal ganglion cell. The Gaussian SD was 10 cone spacings, meaning that receptive field encompassed several hundred cones. Adaptation in the post-cone-adaptation model operated on the integrated signal, and responses of individual cones depended linearly on light input. B, Predictions of integrated responses for several image patches. Top, The locations of the illustrated patches. Bottom, The integrated responses for adapting (blue) and nonadapting (black) cones.

