Figure 6.
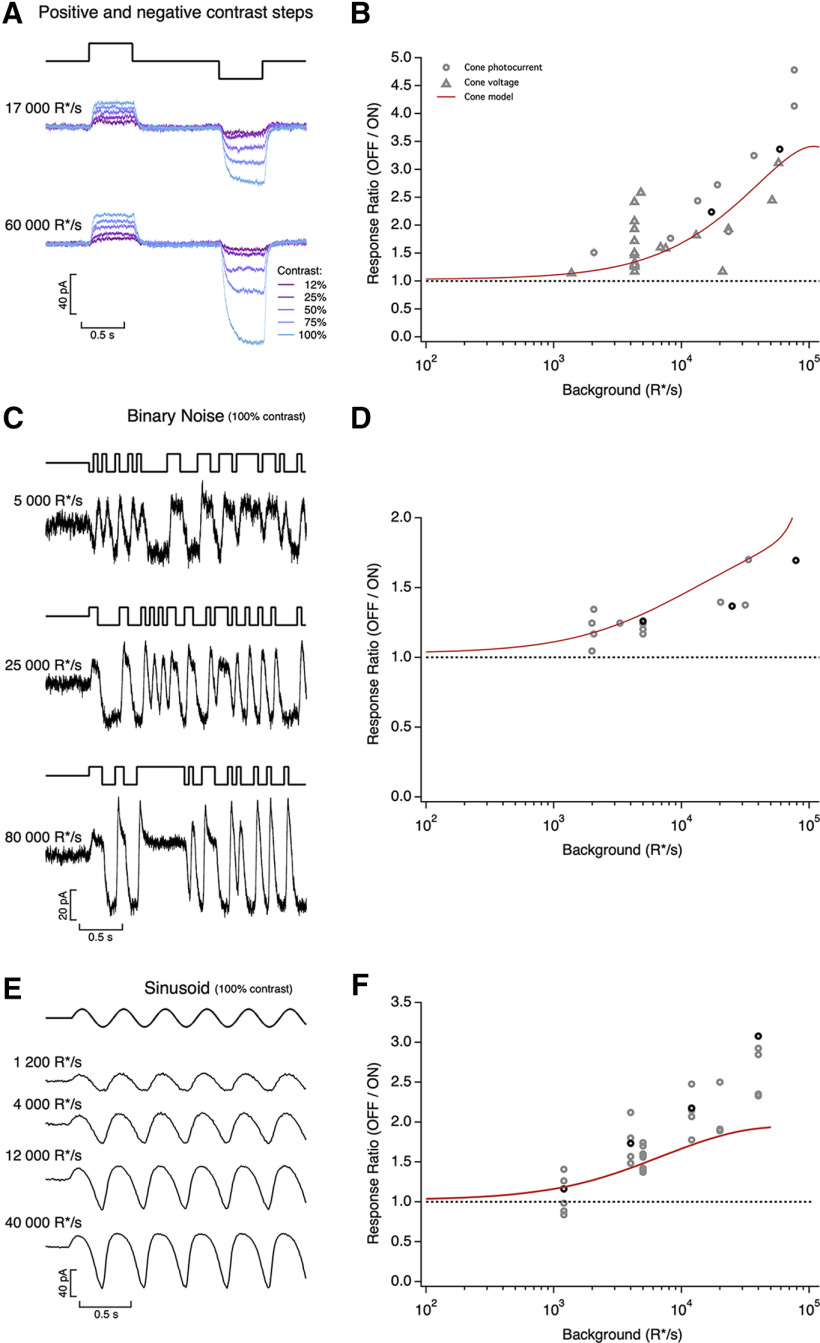
Asymmetric responses to light increments and decrements. A, Average cone photocurrents elicited by light increments and decrements at background light intensities of 17,000 R*/s (top) and 60,000 R*/s (bottom). Decrements produced larger responses than symmetric increments for Weber contrasts above 25% (10 traces averaged at each contrast). The asymmetry was larger as background light intensity increased. B, Ratio of mean negative to mean positive response to 100% contrast steps as a function of mean light intensity. Red line shows prediction of biophysical cone phototransduction model. C, Photocurrents elicited by a binary noise stimulus (100% contrast) at three mean light intensities. D, Ratio of mean negative to mean positive response to binary noise as a function of mean light intensity. Red line shows prediction of biophysical cone model. E, Photocurrents elicited by sinusoidal stimuli (temporal frequency 2.5 Hz, 100% contrast) at four mean light intensities. F, Ratio of peak negative to peak positive response as a function of mean light intensity. Red line is prediction from biophysical cone phototransduction model.

