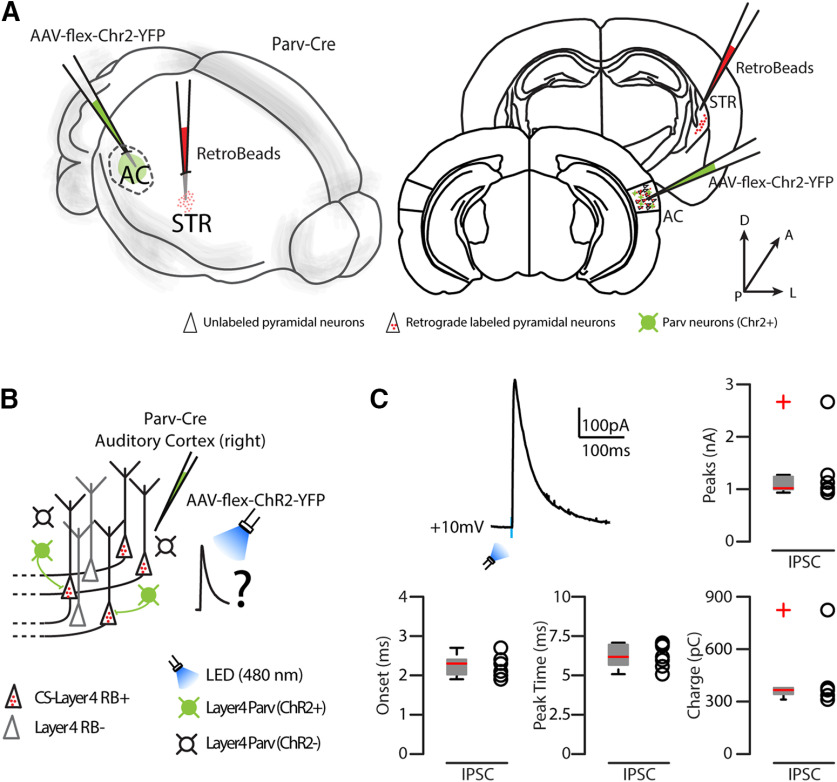
Figure 10.
Parv-ChR2-evoked inhibitory inputs onto CS-L4 neurons. A, Left, Schematic of the injection sites in 3D. Right, Schematic of the Allen Brain Atlas tables and coordinates used for injections and imaging; 30 nl of red RBs was injected in the right striatum, 30 nl of AAV-flex-ChR2-YFP was injected in the right AC, while imaging and recordings were performed in the right AC of Parv-Cre transgenic mice. B, Experimental paradigm for photostimulation of Parv Chr2-positive GABAergic neurons while recording IPSCs from CS-L4 neurons identified by anatomic retrograde labeling. C, Example of IPSCs recorded at 10 mV from L4 CS neurons (n = 8 neurons). Summary plot of IPSC peak (nA), onset (ms), peak time (ms), and charge (pC) recorded in CS-L4 neurons. Box plot and group averages (± SEM).

