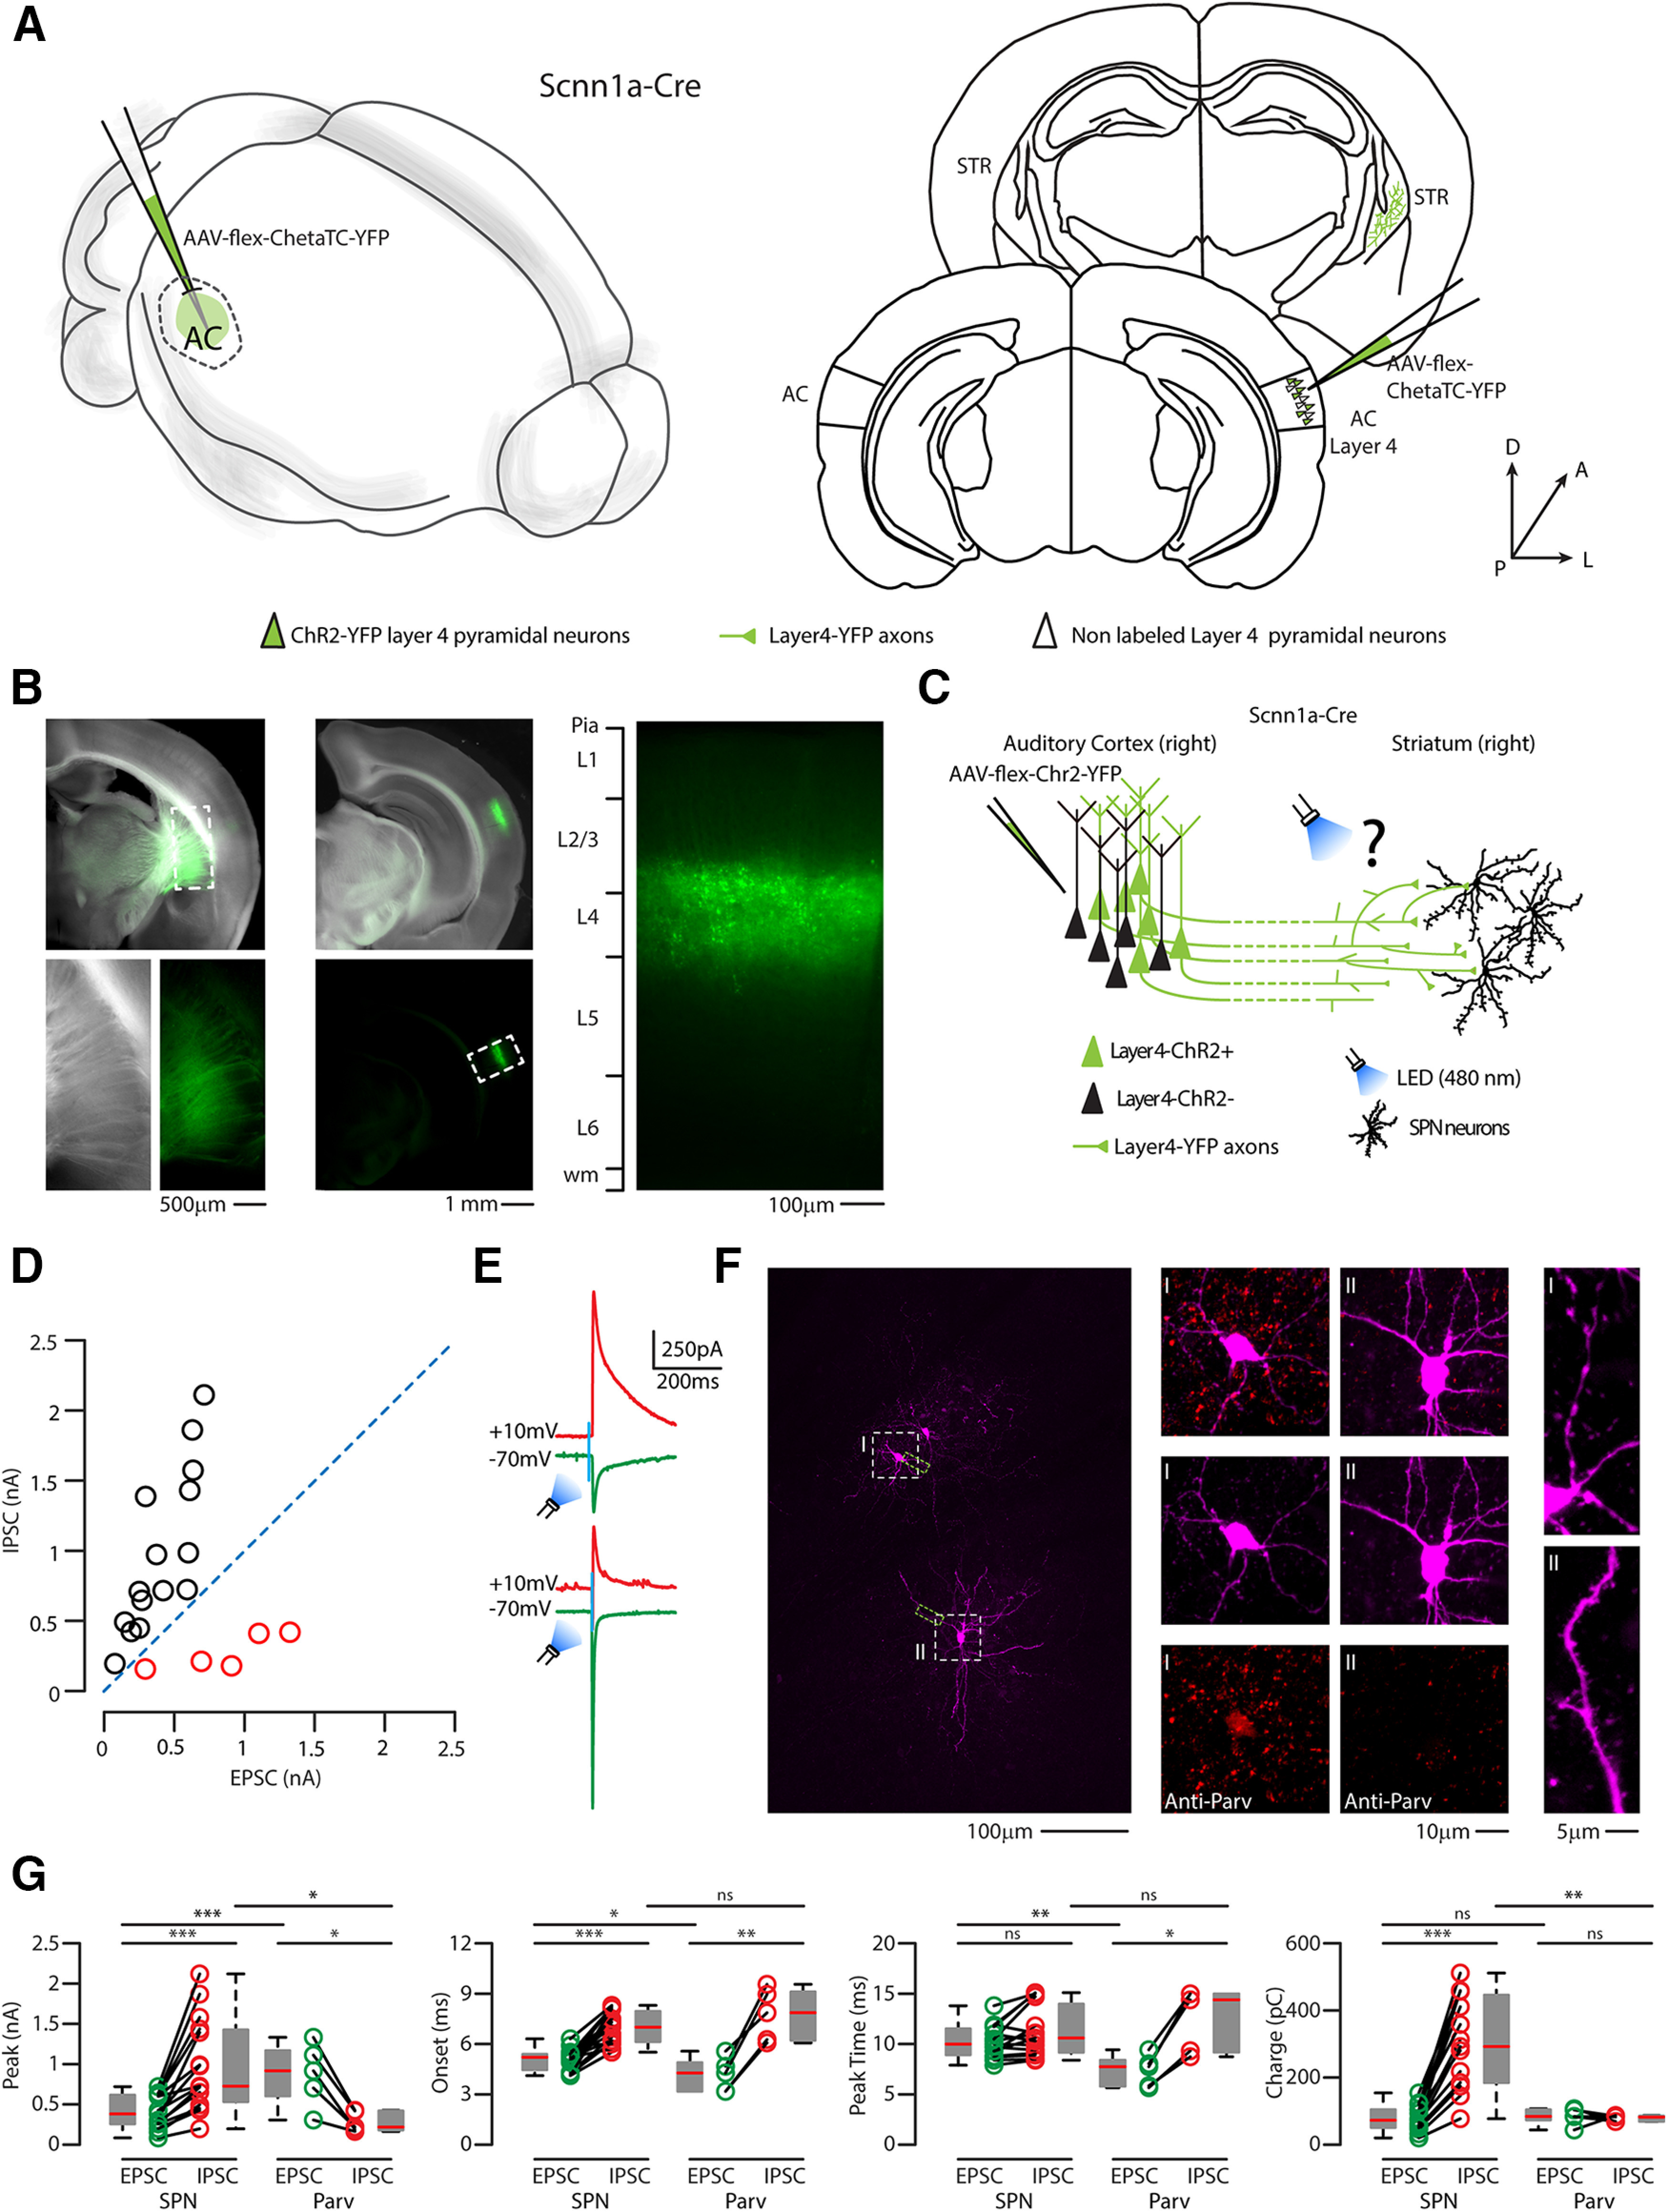
Figure 13.

Photostimulation of CS-L4 projection elicits differentially excitatory and inhibitory inputs onto SPNs and intrastriatal Parv GABAergic neurons. A, Left, Schematic of the injection site in 3D. Right, Schematic of the Allen Brain Atlas tables and coordinates used for injections and imaging; 50 nl of AAV-flex-ChetaTC-YFP was injected in the right AC, while recordings were performed in the right stratum of Scnn1a-Cre heterozygous mice. B, Top left, Bright field low-magnification picture of the injection site in the striatum. Scale bar, 1 mm. Bottom left, Bright field and green fluorescence picture of higher magnification of dotted square in the top left (striatum, anatomic boundaries indicated by the dotted line). Scale bar, 500 µm. Top and bottom center, Overlap of bright field and green fluorescence picture at low magnification of the injected right AC. Scale bar, 1 mm. Left, Representative high-magnification image of YFP (green)-expressing L4 neurons in the injected AC, with layer reference on the left bar. Scale bar, 100 µm. C, Schematic represents the experimental paradigm: CS-L4 neurons in the AC-expressing Cheta-TC and YFP project to the right striatum, where local neurons were recorded while flashing a blue LED (480 nm). D, E/I graph of the 20 striatal neurons recorded. Their distribution and their E/I balance can identify two populations: one has an E/I ratio < 1 (black circles), and the other has an E/I ratio > 1 (red circles). E, Representative traces of EPSCs (green) and IPSCs (red) recorded in the first population (top traces) and the second one (bottom traces) while flashing the blue LED at 7 mW/mm2. F, Left, High-magnification confocal images of confocal images of intrastriatal Parv GABAergic neuros (I) and SPN (II). Green dashed boxes represent the location of the confocal images of the dendrite for each neuron. Scale bar, 100 µm. Middle left, From top to bottom, Parv GABAergic neuron (I) immunostained with anti-Parv. Middle right, From top to bottom, SPN (II) immunostained with anti-Parv. Scale bar, 10 µm. Right top, High-magnification epifluorescence image of the dendrite of an intrastriatal Parv GABAergic neuron (I) displays the absence of spines. Right bottom, High-magnification epifluorescence image of the dendrite of an SPN (I) displays high-density dendritic spines. Scale bar, 5 µm. G, Quantification of EPSC (green) and IPSC (red) parameters: peak (pA), onset of response (ms), time to reach the peak (ms), and Charge (pC). Box plots represent median value and distribution. *p < 0.05. **p < 0.01. ***p < 0.005.
