
Figure 7.
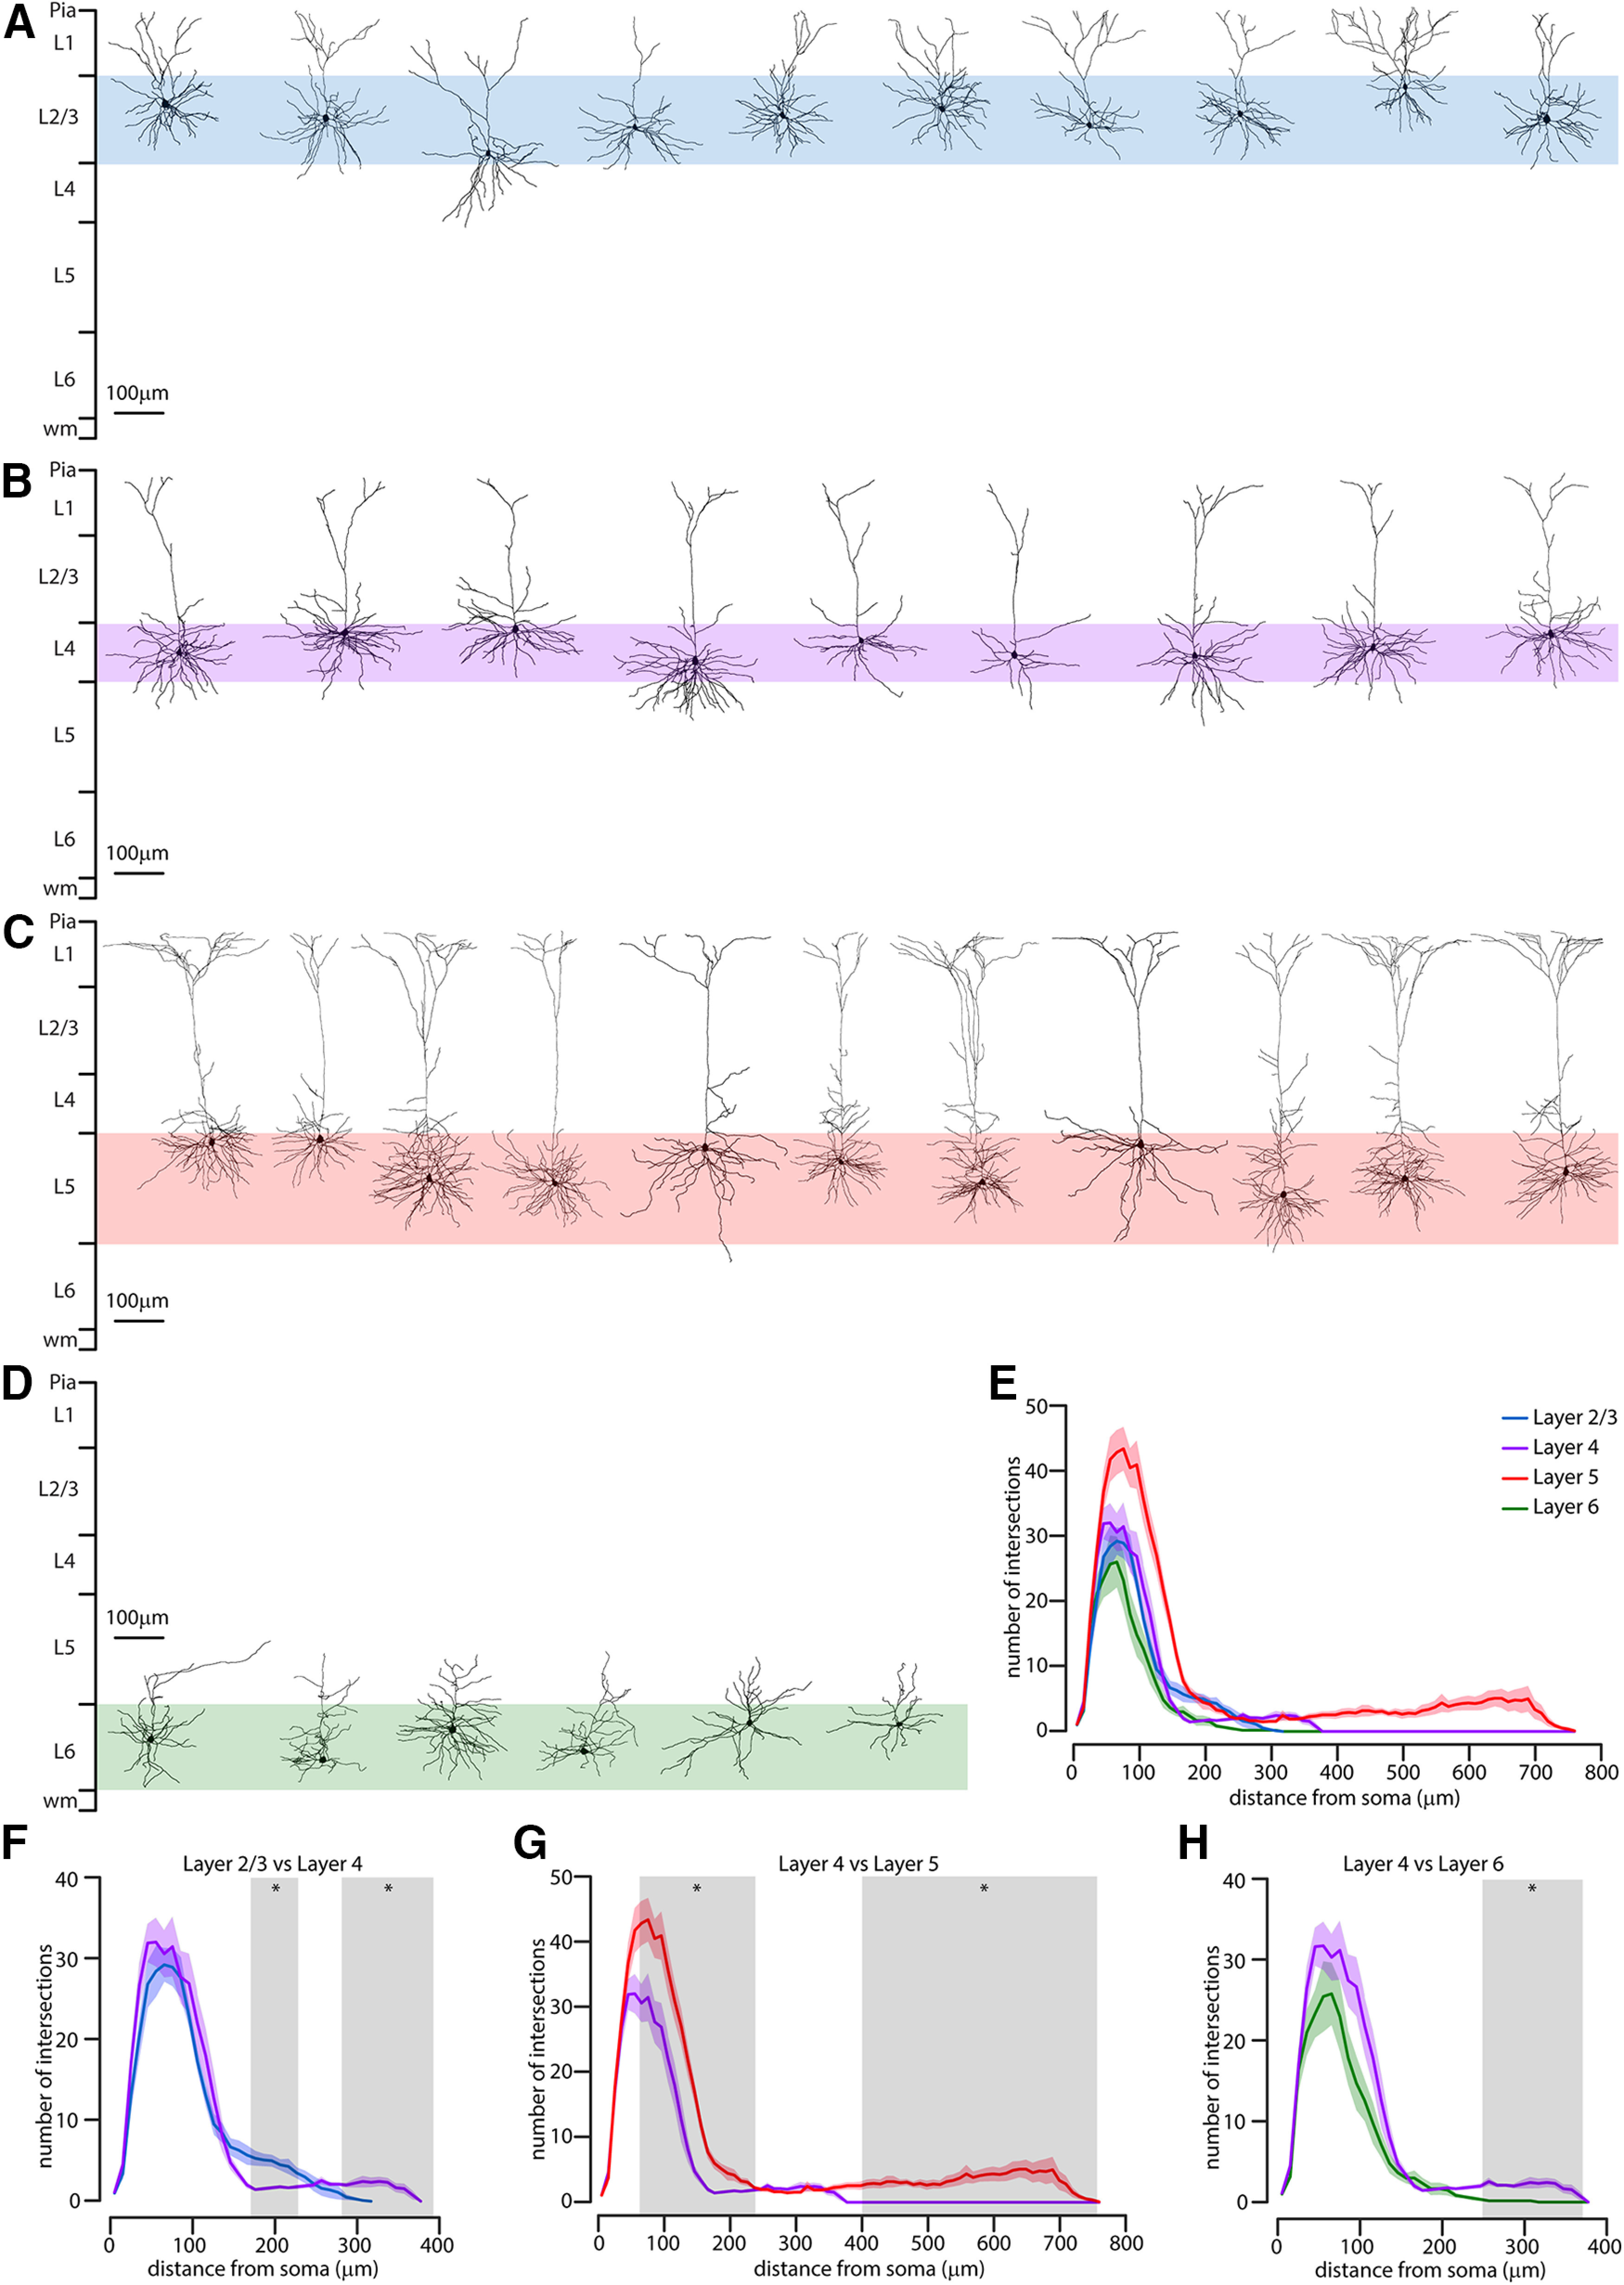
Anatomical characterization of costicostriatal pyramidal neurons. A, Morphologic reconstruction of the dendrites of L2/L3 corticostriatal neurons (n = 10 from 5 animals). B, Morphologic reconstruction of the dendrites of L4 corticostriatal neurons (n = 9 from 8 animals). C, Morphologic reconstruction of the dendrites of L5 corticostriatal neurons (n = 11 from 6 animals). D, Morphologic reconstruction of the dendrites of L6 corticostriatal neurons (n = 6 from 5 animals). E, Overall Sholl profile (± SEM) of the four analyzed neuronal groups, color-coded for layers, expressed as number of intersection of dendrites and shells of 10 µm radius increments from soma. F, Comparison of the Sholl profile (± SEM) of L2/L3 corticostriatal neurons (blue) compared with CS-L4 neurons (purple). Gray area represents the distance from soma where the two populations have statistically significant difference in the number of intersections (rank-sum test, p < 0.05). G, Comparison of the Sholl profile (± SEM) of CS-L4 neurons (purple) compared with L5 corticostriatal neurons (red). Gray area represents the distance from soma where the two populations have statistically significant difference in the number of intersections (rank-sum test, p < 0.05). H, Comparison of the Sholl profile (± SEM) of CS-L4 neurons (purple) compared with L6 corticostriatal neurons (green). Gray area represents the distance from soma where the two populations have statistically significant difference in the number of intersections (rank-sum test, p < 0.05).