
Figure 8.
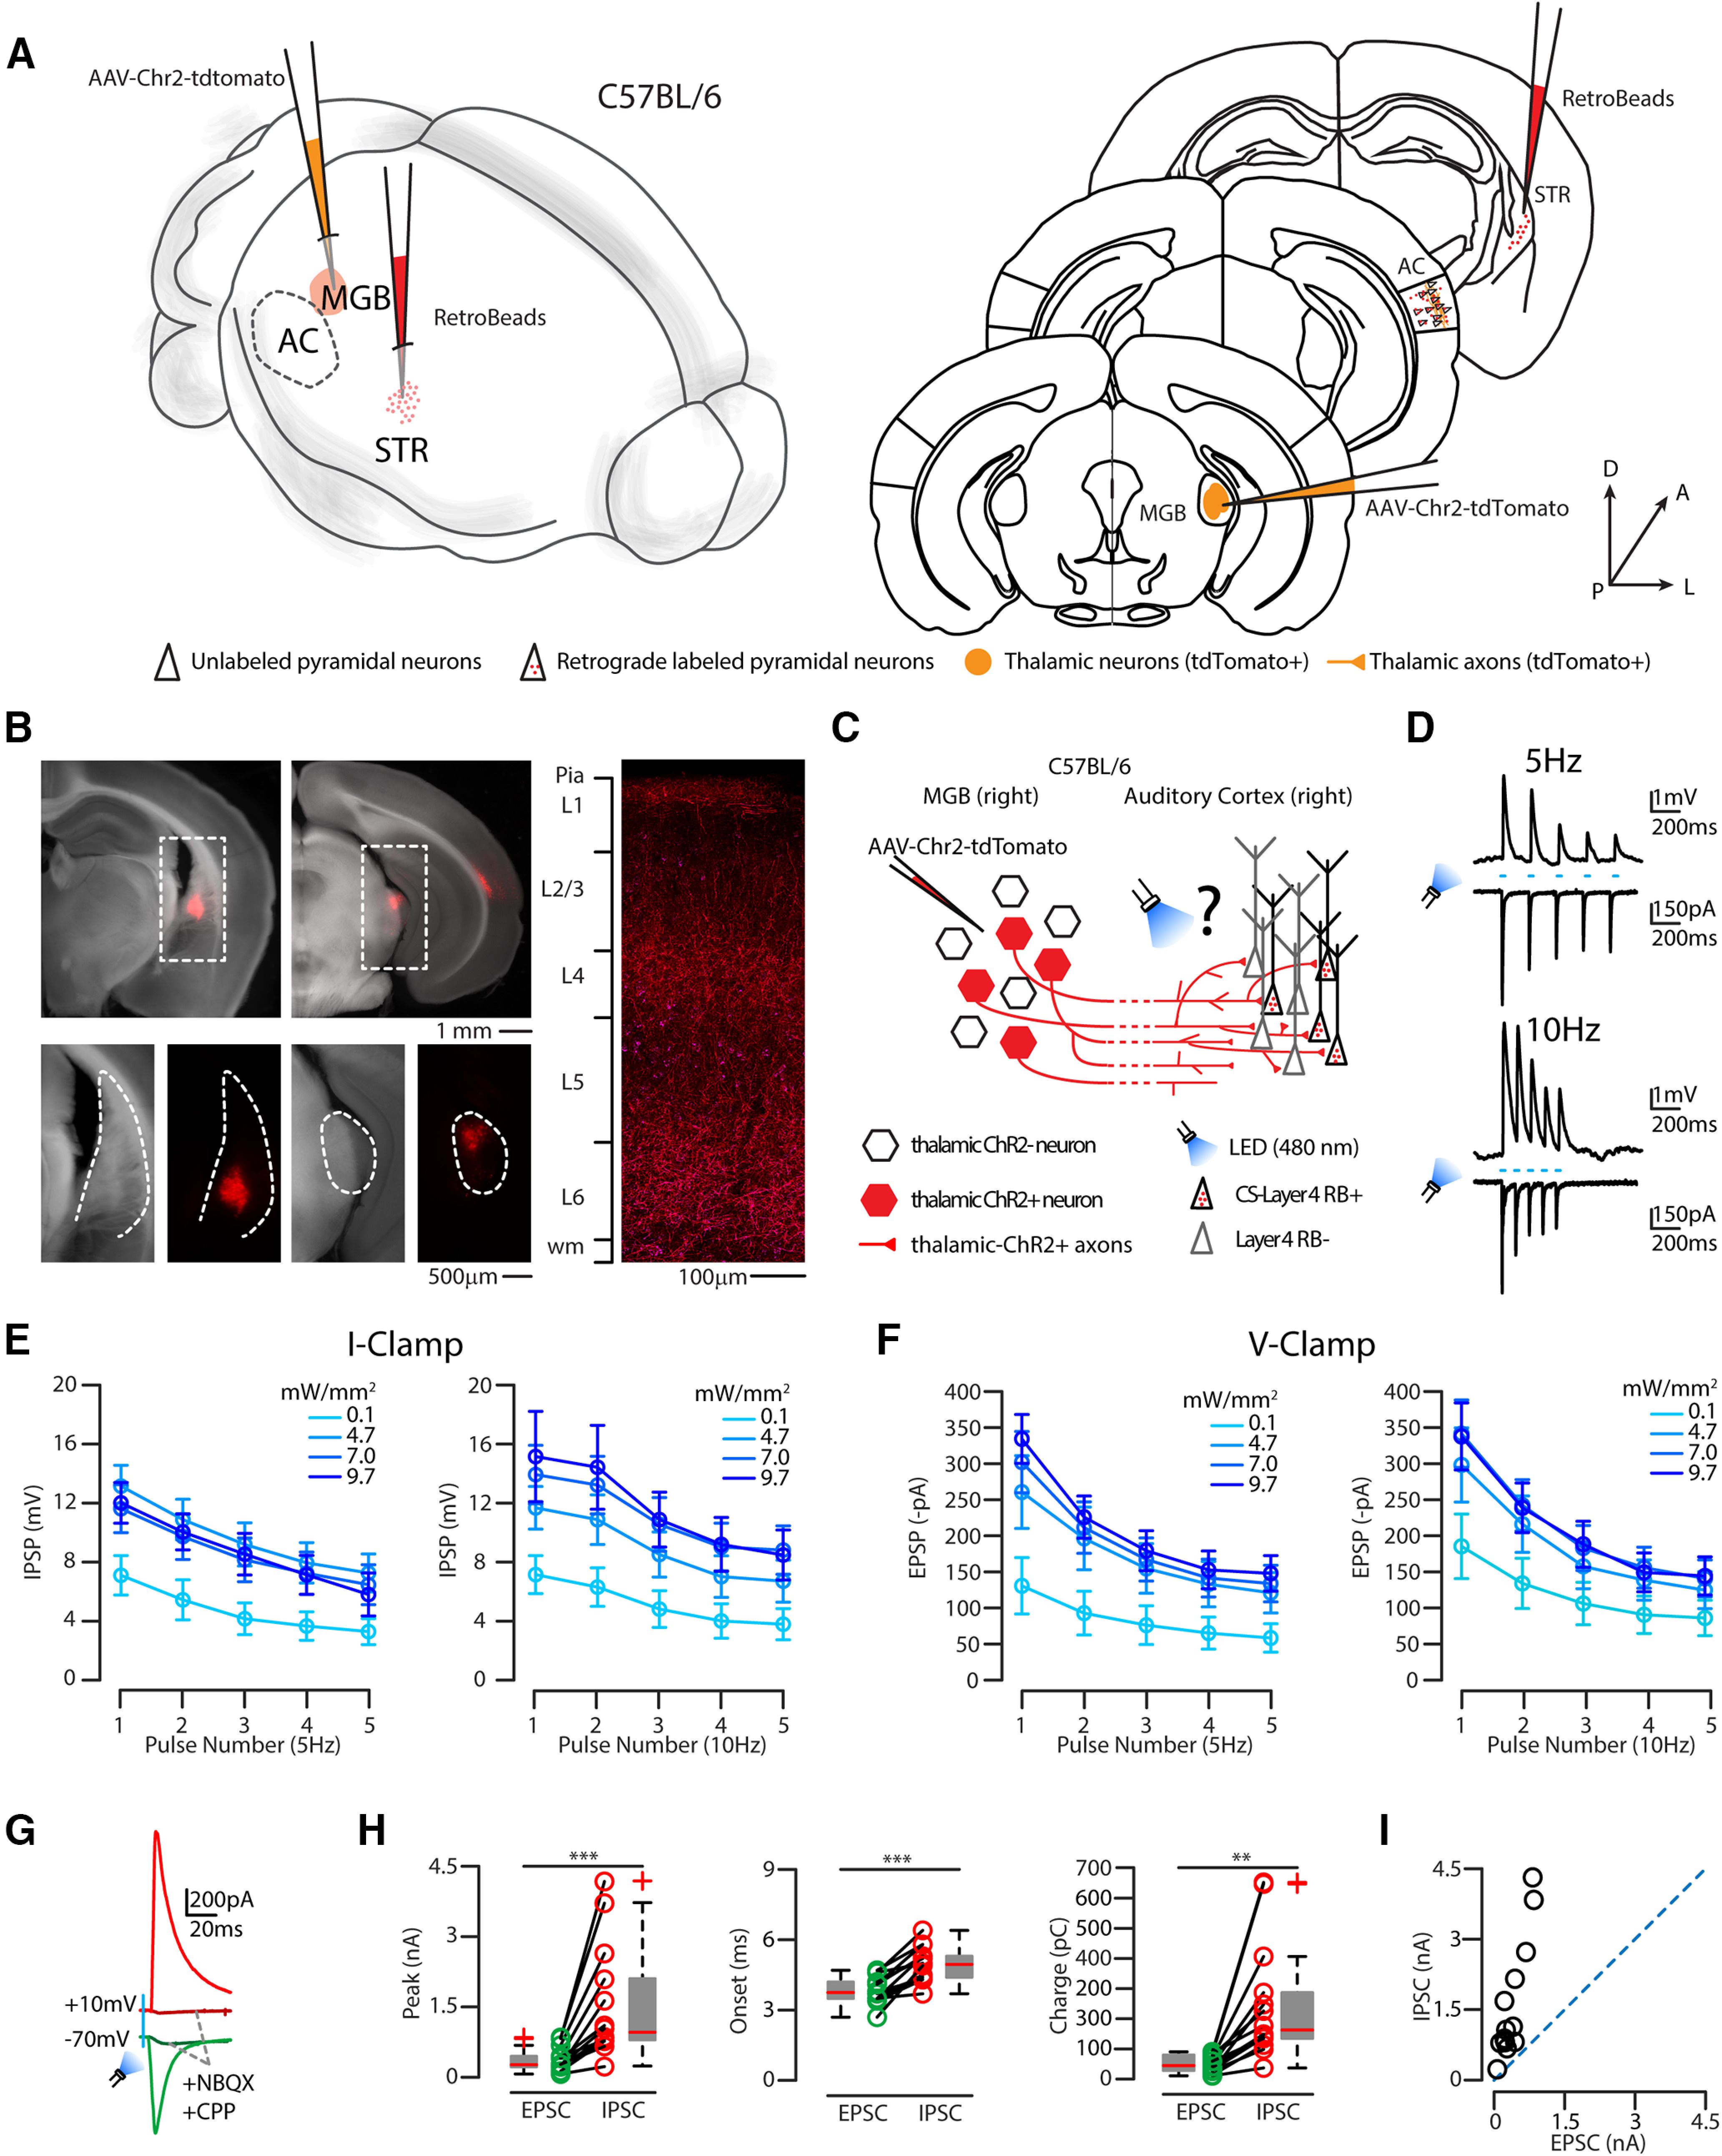
Thalamic monosynaptic excitatory and feedforward disynaptic inputs onto CS-L4 neurons. A, Left, Schematic of the injection sites in 3D. Right, Schematic of the Allen Brain Atlas tables and coordinates used for injections and imaging; 30 nl of red RBs was injected in the right striatum, 30 nl of AAV-ChR2-tdTomato was injected in the right MGB, while imaging and recordings were performed in the ipsilateral AC of C57BL/6 mice. B, Top left, Bright field and red fluorescence overlay of low-magnification images of the injection site in the striatum. Scale bar, 1 mm. Top right, Bright field and red fluorescence overlay of low-magnification picture of the injection site in the MGB. Scale bar, 1 mm. Bottom left, Bright field and red fluorescence picture of higher magnification of dotted square in the top left (striatum, anatomic boundaries indicated by the dotted line). Scale bar, 500 µm. Bottom right, Bright field and red fluorescence picture of higher magnification of dotted square in the top right (dotted line indicates MGB, anatomic boundaries). Scale bar, 500 µm. Right, Representative high-resolution confocal image of tdTomato (red) expressing thalamic axons and red RB+ neurons (magenta) in the ipsilateral AC layer reference on the left bar. Scale bar, 100 µm. C, Schematic represents the experimental paradigm: thalamic neurons expressing ChR2 projects to L4 of the ipsilateral AC, in which CS-L4 neurons (identified by red bead labeling) were recorded while flashing a blue LED (480 nm). D, Top two, Representative I-clamp (top) and V-clamp (bottom) trace while flashing the blue light at 5 Hz for 5 pulses. Bottom two, Representative I-clamp (top) and V-clamp (bottom) trace while flashing the blue light at 10 Hz for 5 pulses. E, Summary plot of I-clamp recordings of EPSPs, while flashing the blue light at 5 or 10 Hz for 5 pulses, at four different light powers. Data are mean ± SEM. F, Summary plot of V-clamp recordings of EPSCs, while flashing the blue light at 5 or 10 Hz for 5 pulses, at four different light powers. Data are mean ± SEM. G, Representative trace of EPSCs (green trace) and IPSCs (red trace) recorded from a CS-L4 neuron. Dark green (EPSCs) and dark red traces (IPSCs) were recorded after bath application of NBQX and CPP and demonstrate that thalamic inputs are excitatory only and that inhibition is disynaptic on ChR2 photoactivation. H, Quantification of EPSC and IPSC parameters: peak (pA), onset of response (ms), and charge (pC). Box plots represent median value and distribution. *p < 0.05. **p < 0.01. ***p < 0.005. I, Summary plot represents each cell E/I value, with all neurons patched distributed in the top left quadrant of the distribution indicating an E/I ratio < 1.