Figure 9.

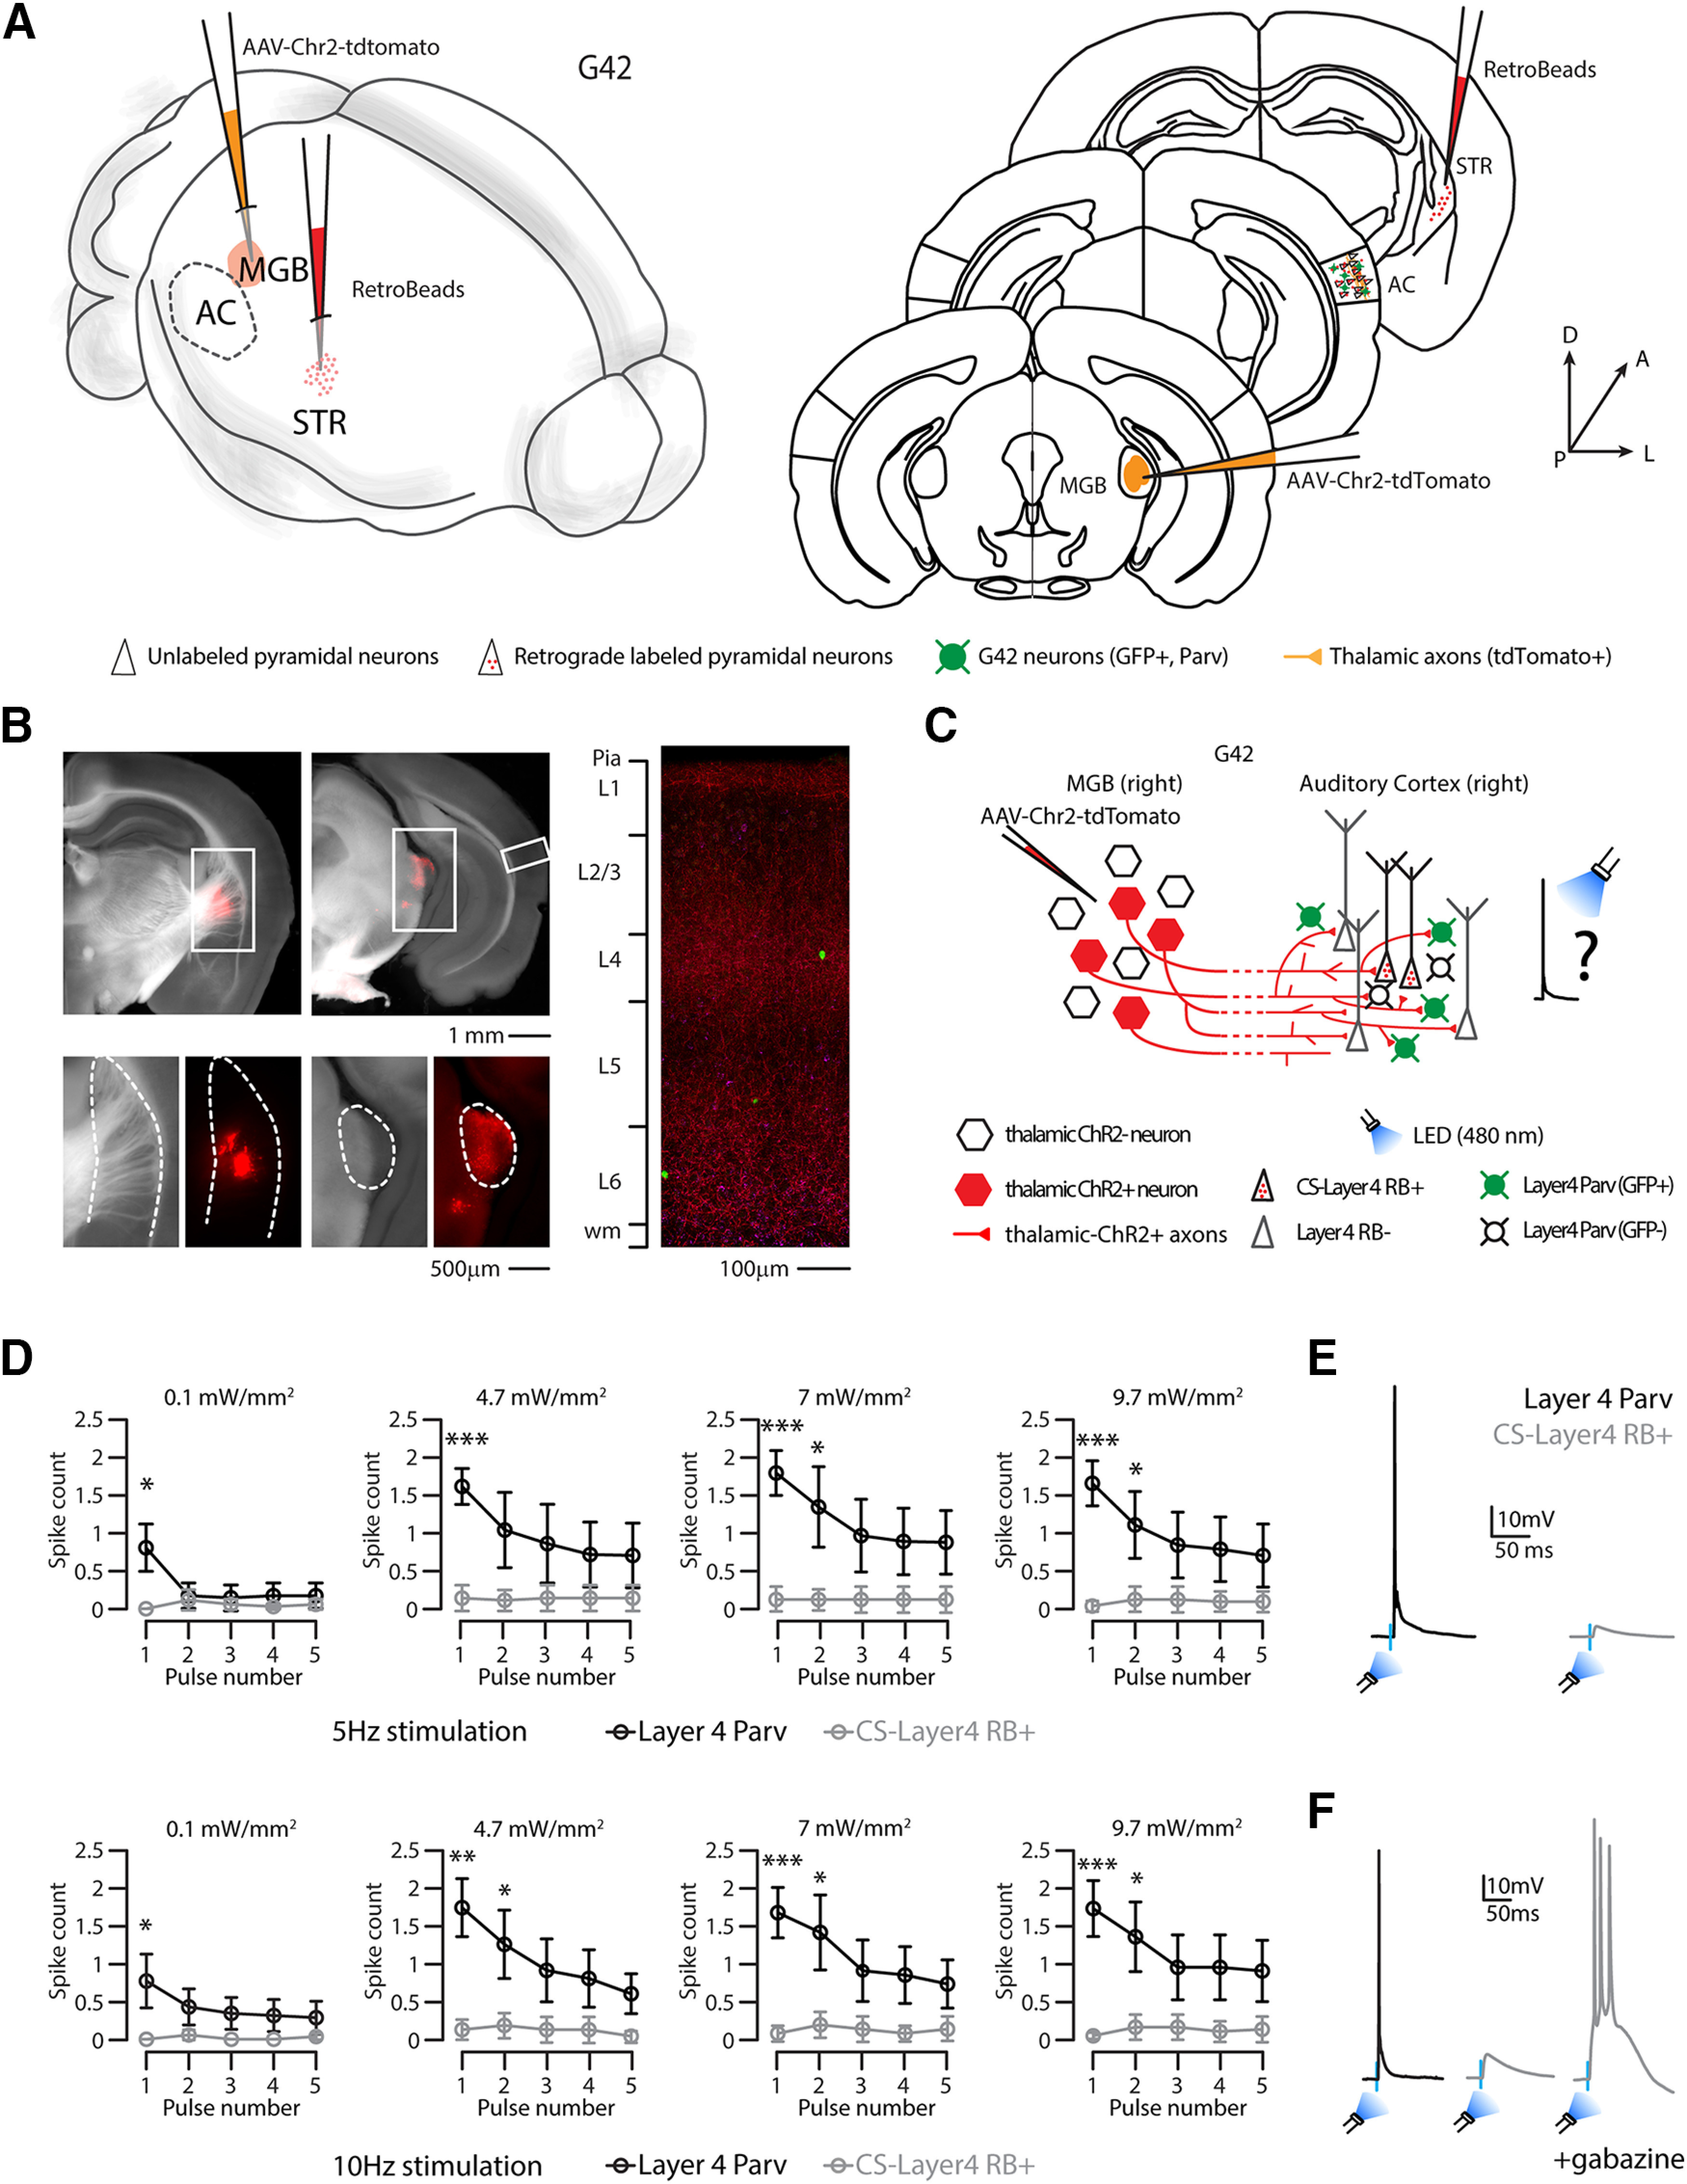
Photostimulation of thalamic projections evoked AP in Parv, but not CS-L4 neurons. A, Left, Schematic of the injection sites in 3D. Right, Schematic of the Allen Brain Atlas tables and coordinates used for injections and imaging; 30 nl of red RBs was injected in the right striatum, 30 nl of AAV-ChR2-tdTomato was injected in the right MGB, while imaging and recordings were performed in the ipsilateral AC of G42 mice expressing GFP in a subset of Parv neurons in the brain. B, Top left, Bright field and red fluorescence overlay of low-magnification images of the injection site in the striatum. Scale bar, 1 mm. Top right, Bright field and red fluorescence overlay of low-magnification picture of the injection site in the MGB. Scale bar, 1 mm. Bottom left, Bright field and red fluorescence picture of higher magnification of dotted square in the top left (striatum, anatomic boundaries indicated by the dotted line). Scale bar, 500 µm. Bottom right, Bright field and red fluorescence picture of higher magnification of dotted square in the top right (the dotted line indicates MGB, anatomic boundaries). Scale bar, 500 µm. Right, Representative high-resolution confocal image of tdTomato (red) expressing thalamic axons, red RB+ neurons (magenta), and Parv-GFP+ neurons (green) in the ipsilateral AC layer reference on the left bar. Scale bar, 100 µm. C, Schematic represents the experimental paradigm: thalamic neurons expressing ChR2 projects to L4 of the ipsilateral AC, in which CS-L4 neurons (identified by red bead labeling) and L4 Parv neurons (GFP+) were recorded while flashing a blue LED (480 nm). D, Top, Quantification of average spike counts in Parv (black) and CS-L4 neurons (gray) while flashing the blue LED at 5 Hz for 5 pulses at 4 different powers. Parv neurons fire APs with significant higher probability at the first pulse of light compared with CS-L4 neurons, at all light powers used. Data are mean ± SEM. N = 7 pairs, 4 animals from 2 litters. *p < 0.05. **p < 0.01. ***p < 0.005. Bottom. Quantification of average spike counts in Parv (black) and CS-L4 neurons (gray) while flashing the blue LED at 10 Hz for 5 pulses at 4 different powers. Parv neurons fire APs with significant higher probability at the first (and second) pulse of light compared with CS-L4 neurons, at all light powers used. Data are mean ± SEM. N = 7 pairs, 4 animals from 2 litters. *p < 0.05. **p < 0.01. ***p < 0.005. E, Representative traces of an L4 Parv neuron (black trace) and a CS-L4 neuron (gray trace) recorded during blue LED photostimulation at minimal power to elicit an AP in the Parv neuron. A couple of GFP/red-bead+ neurons was considered a pair when their soma were closer than 100 µm. While all Parv neurons were firing an AP, none of the associated CS-L4 neurons could fire. N = 10 pairs, 4 animals from 1 litter. F, Representative traces of a L4 Parv neurons (black) and a CS-L4 neuron (gray) while flashing the light at the minimum power to elicit an AP in the Parv neuron. In the presence of gabazine, the same light power can elicit multiple APs in the CS-L4 neuron (right).
