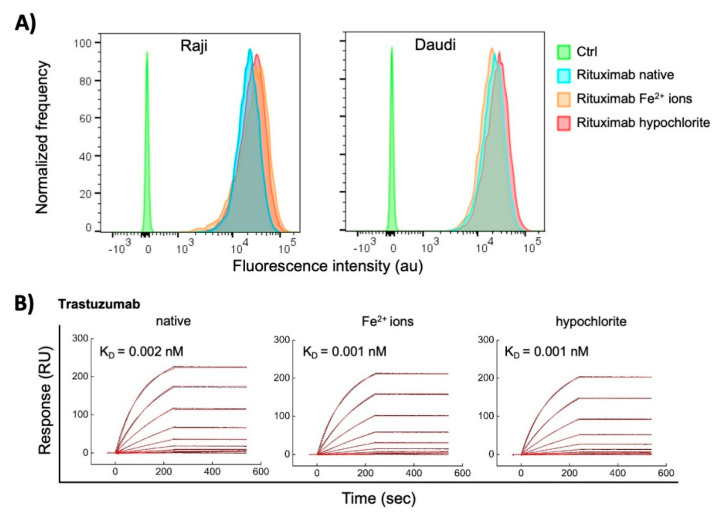
Figure 7.
Interaction of native Abs and those treated with redox agents therapeutic with their cognate antigens. (A) Flow cytometry analyses of binding of Rituximab to human B cell lymphoma cell lines, expressing CD20. Rituximab at 1 mg/mL was exposed to a 500 μM final concentration of FeSO4 or 200 μM NaClO. Native and treated Rituximab at final concentration of 10 μg/mL was incubated with Raji and Daudi cell lines. The histograms depict the normalized frequency of fluorescence intensity indicating the binding of the Ab to the cell. The control (Ctrl) represents the binding of the secondary anti-human IgG to the cells. (B) Surface plasmon resonance evaluation of interactions of Trastuzumab. Real-time interaction profiles of native-, ferrous ion- or hypochlorite-treated Trastuzumab to Her2 immobilized on the sensor chip. Trastuzumab at 1 mg/mL was exposed to 500 μM final concentration of FeSO4 or 200 μM NaClO. The binding profiles of generated after injection of serial dilutions (10–0.039 nM) of native and treated Trastuzumab are presented. The black curves indicate the experimentally observed binding response, the red curve depict the kinetic fit, using global Langmuir analyses. The values of equilibrium dissociation constant are shown within each graph. All interaction analyses were performed at 25 °C.

