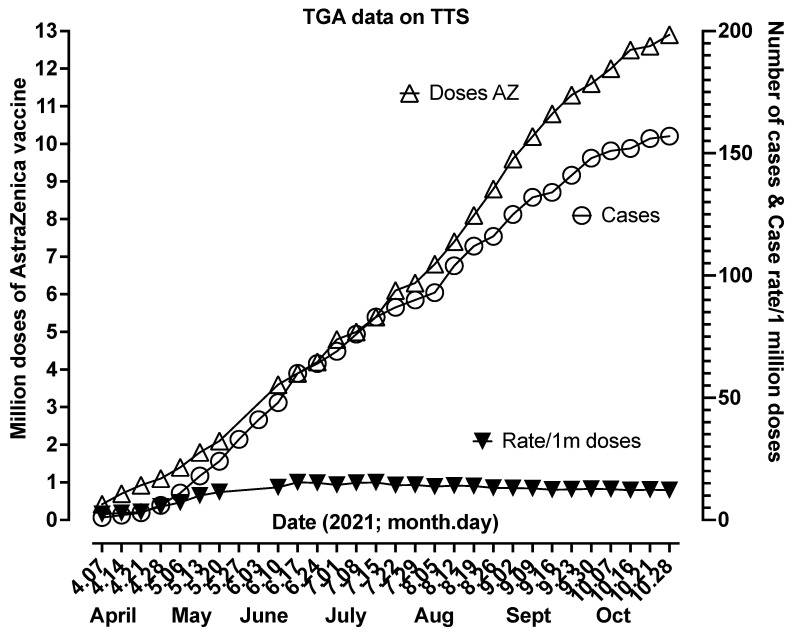
Figure 4.
Cases of TTS as reported weekly by the Australian TGA from the first case reported at the beginning of April 2021 until the end of October 2021. The figure shows the cumulative number of AstraZeneca (AZ) doses administered, the cumulative number of TTS cases, and the TTS rate per million AZ doses. From an initial slow case attainment, the rate seemed to stabilize from June to October at around 13–15/million doses. Please see [31] for additional details.

