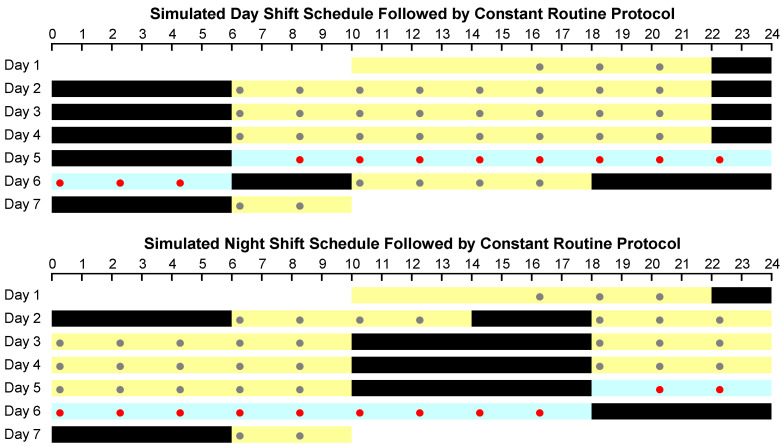
Figure 1.
Schematic of the study design, showing the simulated day shift condition (top) and the simulated night shift condition (bottom). In each panel, time of day progresses from left to right, and days progress from top to bottom. Black bars indicate sleep opportunities; yellow bars indicate scheduled wakefulness. The 24 h waking period of the constant routine (CR) protocol that followed three days of simulated day or night shift schedule is shown in blue. Dots denote neurobehavioral test bouts; red dots indicate the test bouts used for analysis.

