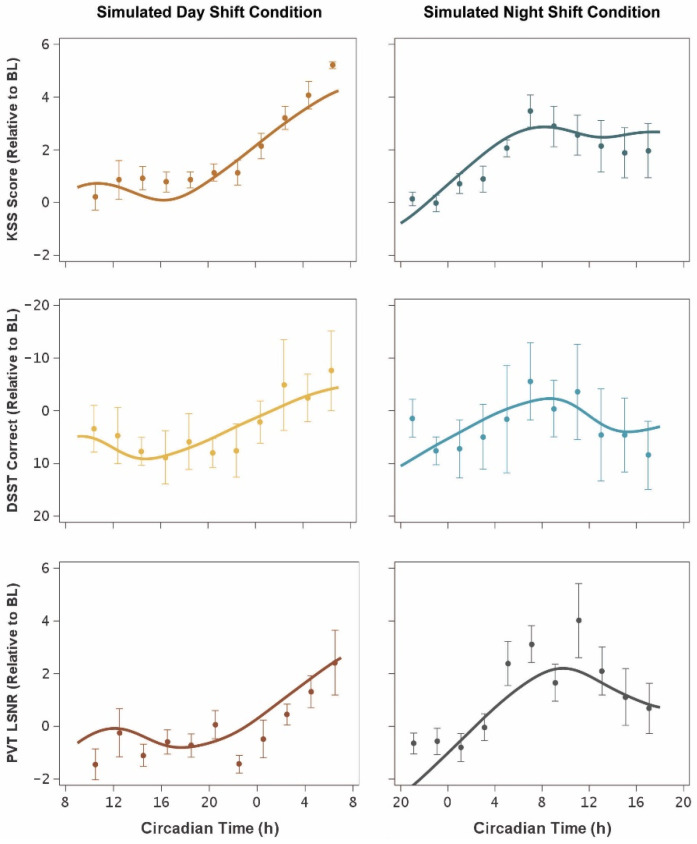
Figure 3.
Temporal profiles of neurobehavioral functioning during the 24 h CR protocol. The graphs show means (±SE) for KSS (top), DSST (middle), and PVT (bottom), expressed relative to baseline (BL) and plotted against mean circadian time (i.e., relative to DLMO), for the simulated day shift condition (left) and the simulated night shift condition (right). Curves represent the mean (accounting for inter-individual differences) of the fitted statistical model of Equation (5). Upwards indicates worse neurobehavioral functioning in all panels.

