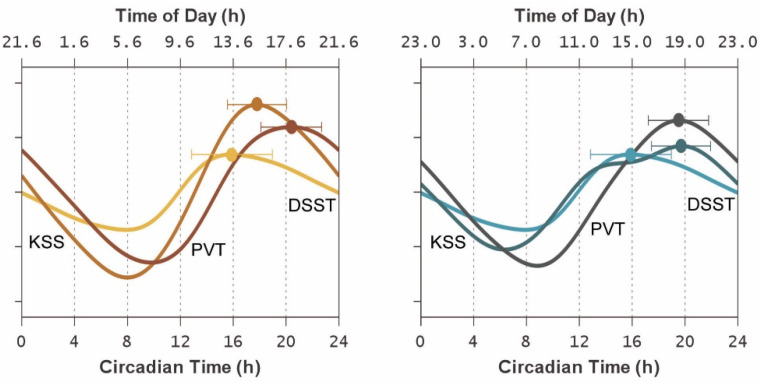
Figure 4.
Endogenous circadian rhythm contributions to neurobehavioral functioning during the 24 h CR protocol. The graphs show the mean (accounting for inter-individual differences) of the circadian component of the fitted statistical model of Equation (5), plotted against circadian time (i.e., relative to DLMO) on the bottom axes and against corresponding mean clock time on the top axes. Curves represent the endogenous circadian rhythm influence on each of the three neurobehavioral outcomes after normalization (i.e., as z scores, to make them comparable in vertical scale) for the simulated day shift condition (left) and the simulated night shift condition (right) using the same color scheme as in Figure 3. Upwards indicates greater circadian drive (corresponding with better neurobehavioral functioning). The secondary bump in the KSS curve in the simulated night shift condition (around 14 h after DLMO) is a result of convolution of the subject-specific circadian rhythm contributions encompassed in the mean. Dots and whiskers represent the task-specific circadian peaks and their 95% confidence intervals. Note the relatively tight clustering of the peaks, regardless of condition, in the late biological afternoon (approximately 16–20 h after DLMO).

