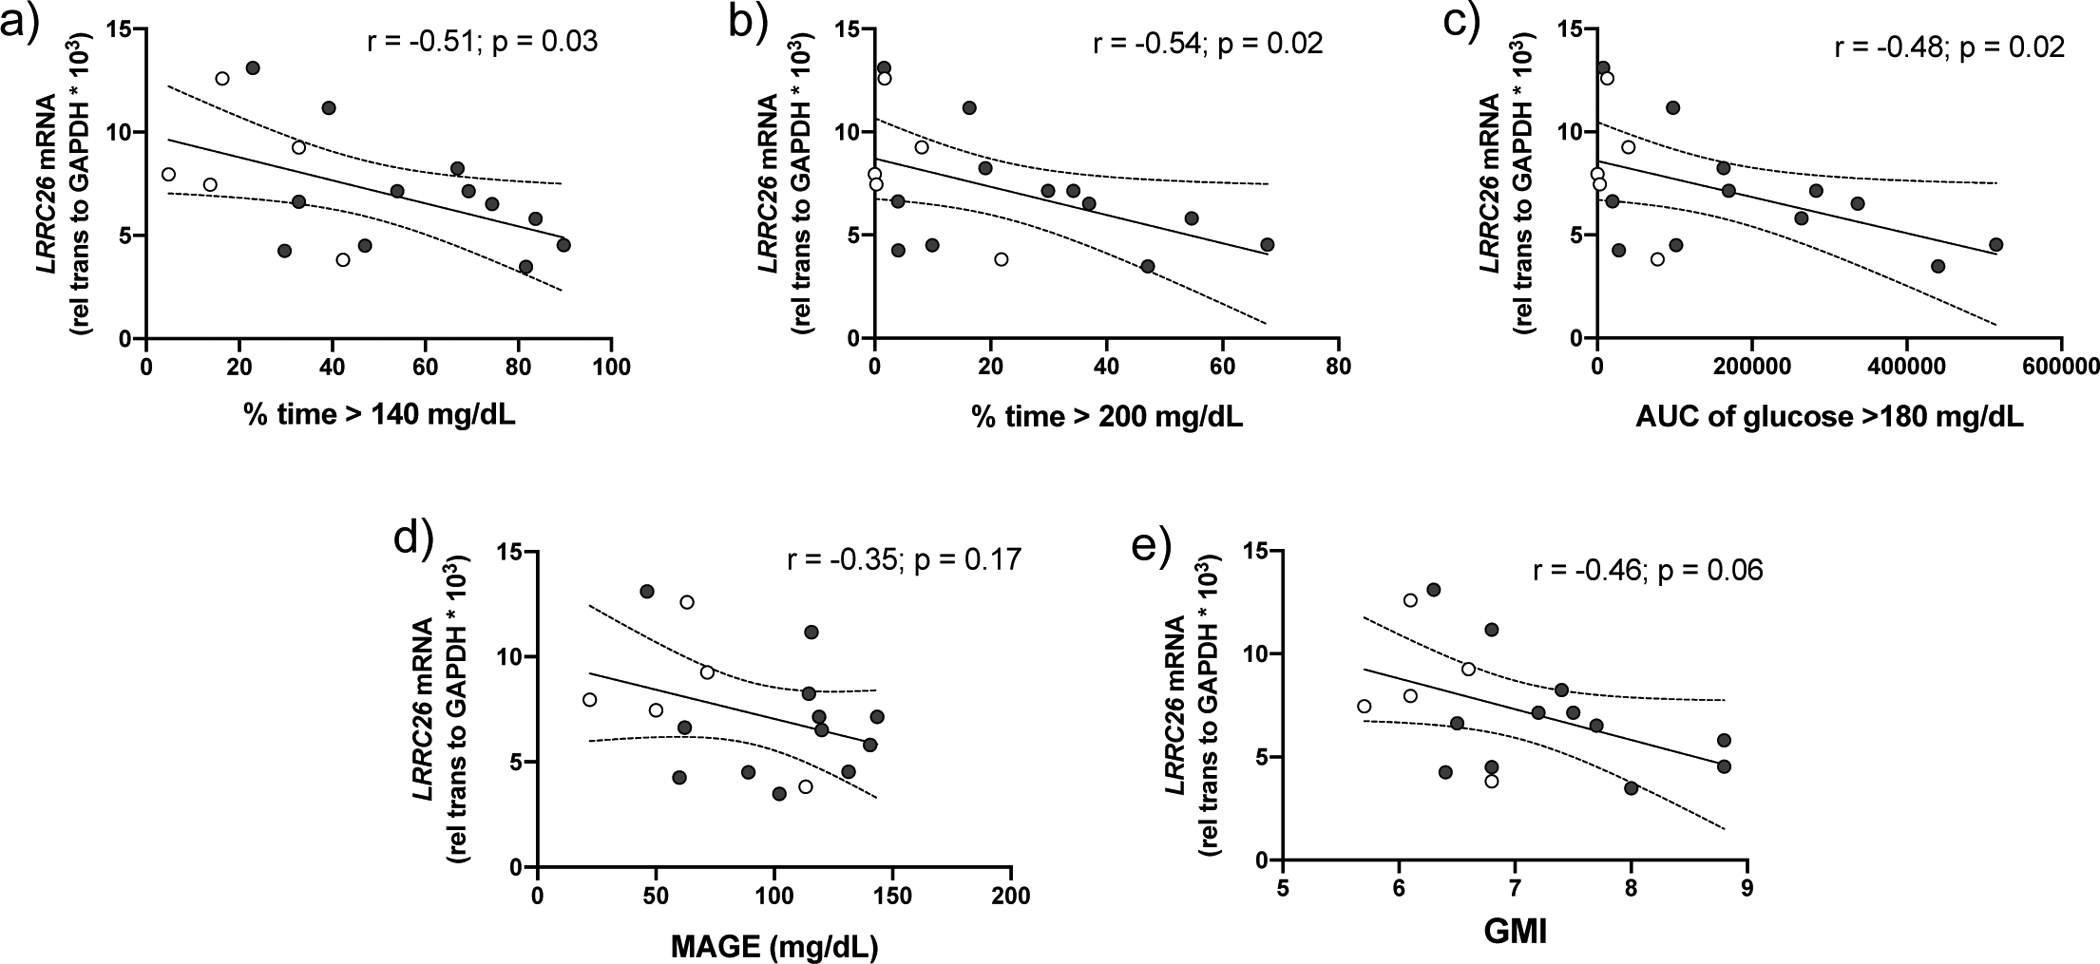
FIGURE 7. Hyperglycaemic excursions correlate with decreased LRRC26 mRNA expression in participants with CF and CFRD.

Inverse correlation between nasal cell LRRC26 expression in CF (n=5, open circles) and CFRD (n=12, shaded circles) with the CGM variables (a) percent time glucose > 140 mg/dL, (b) percent time glucose > 200 mg/dL and (c) average area under the curve of glucose >180 mg/dL. p<0.05, Pearson’s correlation coefficient. There was an inverse trend between LRRC26 expression and the CGM variables (d) mean amplitude of glycaemic excursions and (e) GMI; however, it did not reach statistical significance. p>0.05, Pearson’s correlation coefficient. Graphs include trend line (solid line) and 95% confidence intervals (dashed lines).
