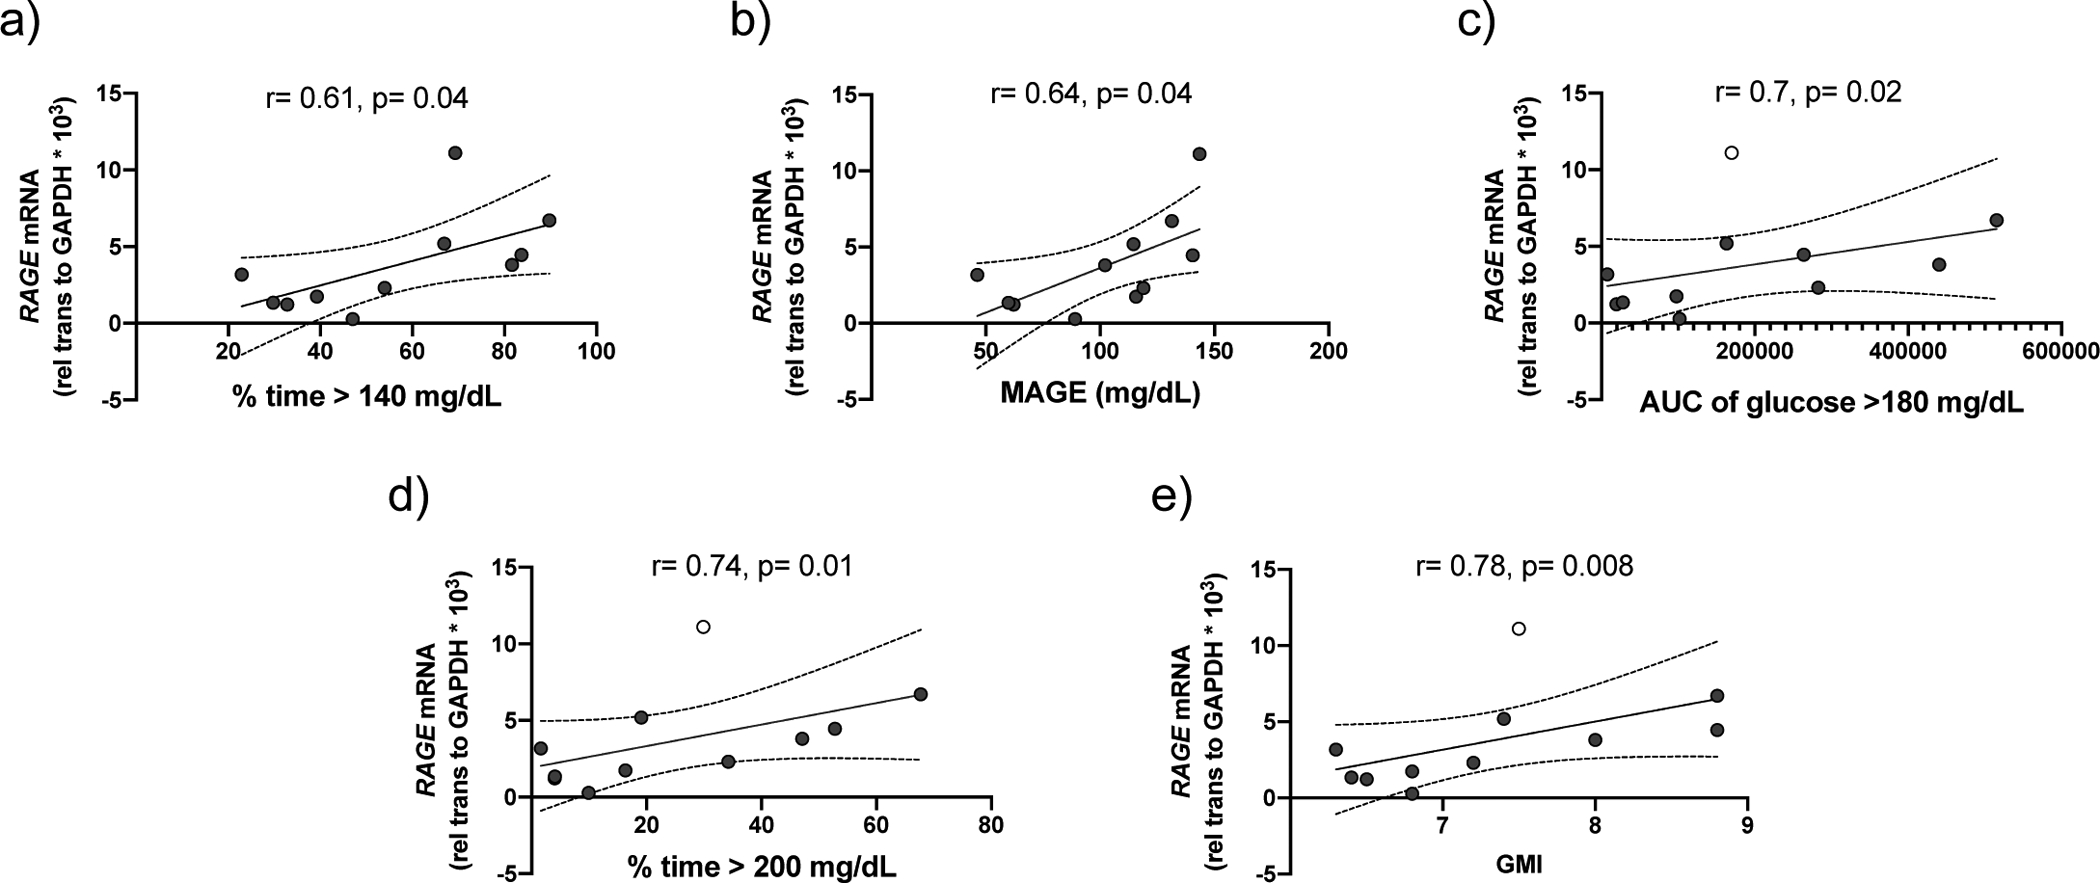
FIGURE 8. RAGE expression is correlated with hyperglycaemic excursions in CFRD.

Correlation between nasal cell RAGE expression in participants with CFRD and with the CGM variables: (a) percent time glucose > 140 mg/dL and (b) mean amplitude of glycaemic excursions. p<0.05, Pearson’s correlation coefficient. After exclusion of an outlier (open circle), there is also a significant correlation between RAGE expression and the CGM variables: (c) area under the curve of glucose >180 mg/dL, (d) % time glucose >140 mg/dL and (e) GMI. P<0.05, Pearson’s correlation coefficient. Graphs include trend line (solid line) and 95% confidence intervals (dashed lines).
