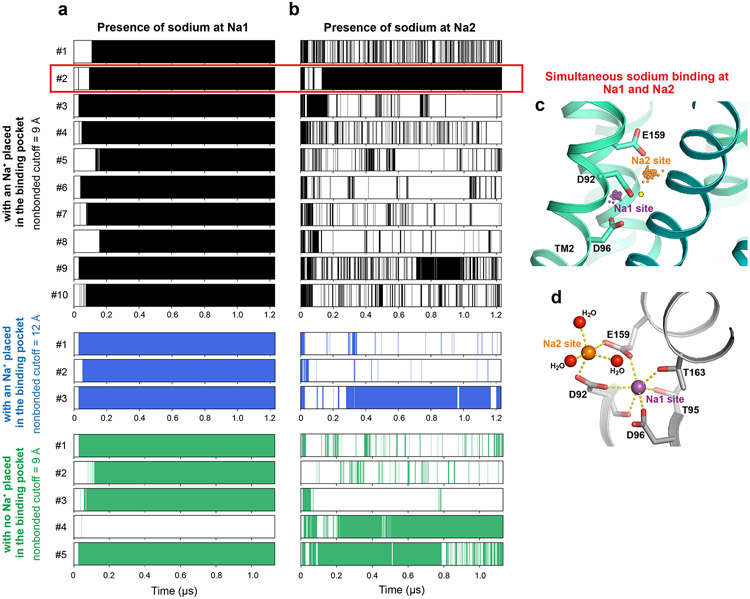
Extended Data Figure 7. Sodium binding sites in molecular dynamics simulations.
a. Shaded regions (black, blue, and green) indicate points in time during each simulation when a sodium ion was present at the Na1 site—in particular, points at which a sodium ion at a distance of 2–5 Å from the T95 side chain oxygen formed a salt bridge with D92 and/or D96. b. Shaded regions indicate points in time during each simulation when a sodium ion was present at the Na2 site—in particular, points at which a sodium ion at a distance of 5–8 Å from the T95 side chain oxygen formed a salt bridge with D92 and/or E159. Both panels a and b show data for simulations under three conditions. In the first two conditions (black and blue), a sodium ion is initially placed in the binding pocket at a position suggested by the potential coordination environment and the cryo-EM density, whereas in the third (black), no sodium ions are initially placed in the binding pocket. The first and third conditions (black and green) used a 9 Å nonbonded interaction cutoff, whereas the second (blue) used a 12 Å cutoff. Plots include equilibration as well as production phases of each simulation. c. Sodium positions from simulation #2 of the first condition (highlighted by red box), where sodium ions bind simultaneously at the Na1 and Na2 sites. Positions of sodium bound at the Na1 site are shown as purple spheres, and positions of sodium bound at the Na2 site are shown as orange spheres (see Methods). In this simulation, a Na+ ion was initially placed at a position proposed on the basis of the potential coordination environment and the cryo-EM density map, shown as a yellow circle. d. Sodium binding sites in a representative frame from the same simulation. Sodium-coordinating residues are shown as sticks. Sodium bound at the Na1 site is shown as a purple sphere and sodium bound at the Na2 site is shown as an orange sphere. Oxygen atoms of water molecules are shown as red spheres.

