Figure 2.

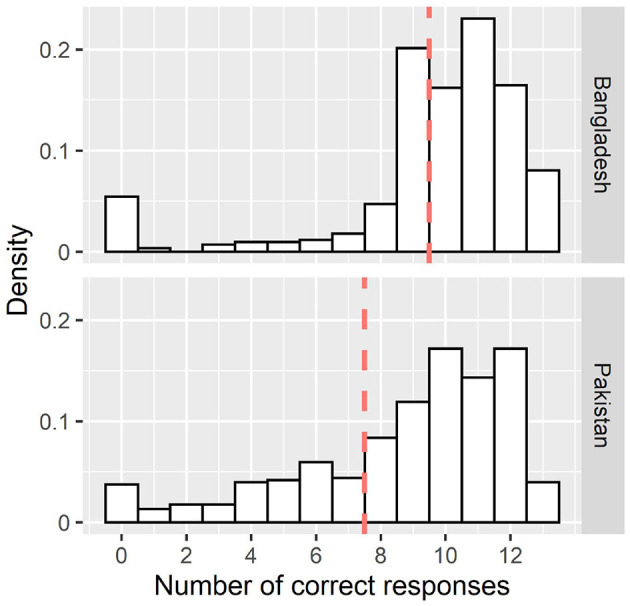
Distribution of the number of correct responses to the 13 questions relating to symptoms of COVID-19. The dashed line represents the cut off to determine “poor” Knowledge (lower 25% of the distribution).

Distribution of the number of correct responses to the 13 questions relating to symptoms of COVID-19. The dashed line represents the cut off to determine “poor” Knowledge (lower 25% of the distribution).