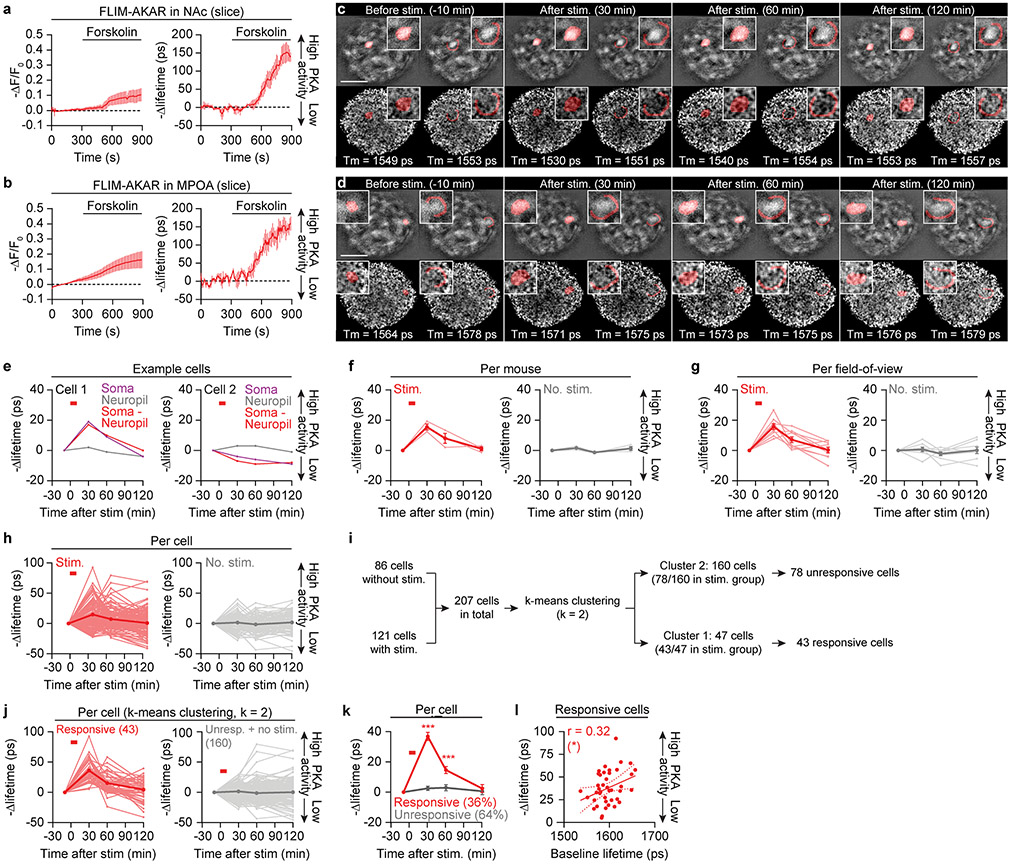
Extended Data Fig. 7 ∣. Persistent PKA activity in the MPOA.
a,b, Application of forskolin to brain slices containing the NAc (a) or the MPOA (b) induces PKA activity, which can be measured with the PKA sensor FLIM-AKAR. PKA activity can be measured from changes either in fluorescence intensity or in fluorescence lifetime of FLIM-AKAR (a: n = 3 slices from 2 mice; b: n = 4 slices from 2 mice). Photobleaching is only seen in the fluorescence intensity traces. The y-axes are flipped to make the plots more intuitive, as FLIM-AKAR fluorescence intensity and fluorescence lifetime decrease with increasing PKA activity.
c-e, cell body ROIs and corresponding neuropil rings for two representative cells (c,d), segmented from the intensity frames (top) and applied to the lifetime frames (bottom) during in vivo two-photon FLIM imaging via a GRIN lens inserted in the MPOA. The ROIs and corresponding rings are shaded red in left and right panels, respectively, and also displayed in insets at higher magnification. The purpose of calculating lifetime changes in both ROIs and in surrounding neuropil rings was to subtract lifetime changes in the neuropil rings from those in the ROIs, thereby isolating changes in cell body PKA activity above and beyond contributions from nearby neuropil. Samples traces of the ROI, neuropil ring, and ROI after neuropil ring subtraction are shown in e (same plotting format as in Fig. 4c; red horizontal bar: Chrimson stimulation). The cell highlighted in c (Cell 1) showed increased PKA activity following stimulation in the ROI but not in the surrounding neuropil. See Methods for detailed descriptions of ROI segmentation and neuropil ring calculation. Scalebar: 200 μm.
f-h, Average lifetime traces per mouse (f: n = 3 mice), per field-of-view (g: n = 8-9 fields of view, with fields of view from the same mouse spaced a minimum of 80 μm apart along the Z-axis), and per cell (h: n = 121, 86 cells) show persistent increases in PKA activity in the MPOA after optogenetically stimulating AVPV/PVpo dopamine axons in the MPOA. Thin lines: individual traces. Thick lines: means across traces. No change in PKA activity is seen in the no-stimulation controls. Neuropil changes were subtracted for all traces. Individual traces in f and g were obtained by averaging changes in fluorescence lifetime across all cells in each mouse (f) or in each field of view (g).
i,j, K-means clustering (i, k = 2) reveals a sub-population of 36% of the MPOA neurons that show strong responses to dopamine stimulation (j, left). The other cluster includes cells that did not respond to the stimulation and cells in the no-stimulation control experiments (j, right; n = 43, 164 cells). We used this clustering method to identify responsive cells because each field of view was only imaged once per experimental condition. Neuropil changes were subtracted for all traces.
k, Mean traces of cells analyzed in j (n = 43 responsive and 78 unresponsive cells from 3 males).
l, Across responsive cells, the magnitude of change in FLIM-AKAR lifetime with dopamine stimulation was positively correlated with baseline lifetime, indicating that cells that show the strongest stimulation-evoked increases in PKA activity also exhibited lower initial PKA activity (Pearson correlation; n = 43 cells from 3 males). Mean ± s.e.m. unless otherwise specified. *p<0.05, ***p<0.001. See Supplementary Table 1 for statistics.

