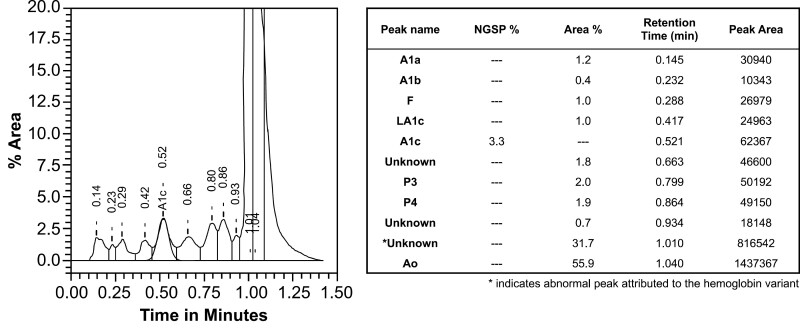
Figure 2.
High-performance ion exchange chromatography results for the determination of hemoglobin A1c. This graph was generated by the analyzer and is shown as is, with the table transcribed verbatim. % Area is represented by the y-axis, Time in minutes by the x-axis, and the abnormal peak (subsequently identified as the Hemoglobin North Manchester peak) is identified by the asterisk.

