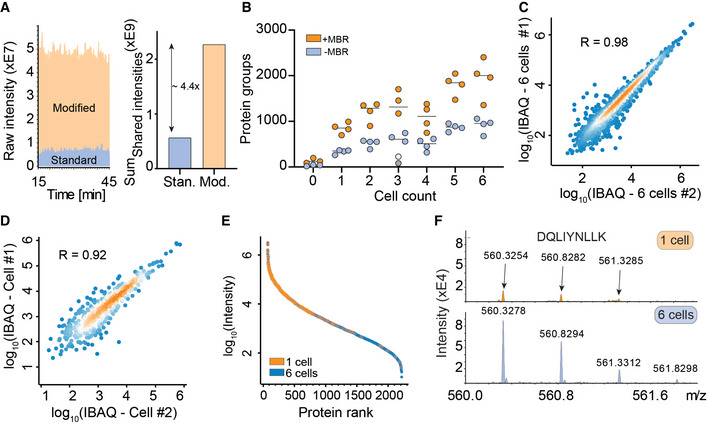
Figure 2. A novel mass spectrometer allows the analysis of true single‐cell proteomes.

- Raw signal increase from standard versus modified TIMS‐qTOF instrument (left) and at the evidence level (quantified peptide features in MaxQuant) (right).
- Proteins quantified from one to six single HeLa cells, either with “matching between runs” (MBR) in MaxQuant (orange) or without matching between runs (blue). The outlier in the three‐cell measurement in grey (no MBR) or white (with MBR) is likely due to failure of FACS sorting as it identified a similar number of proteins as blank runs (Horizontal lines within each respective cell count indicate median values).
- Quantitative reproducibility in a rank order plot of a six‐cell replicate experiment.
- Same as C for two independent single cells.
- Rank order of protein signals in the six‐cell experiment (blue) with proteins quantified in a single cell colored in orange.
- Raw MS1‐level spectrum of one precursor isotope pattern of the indicated sequence and shared between the single‐cell (top) and six‐cell experiments (bottom).
