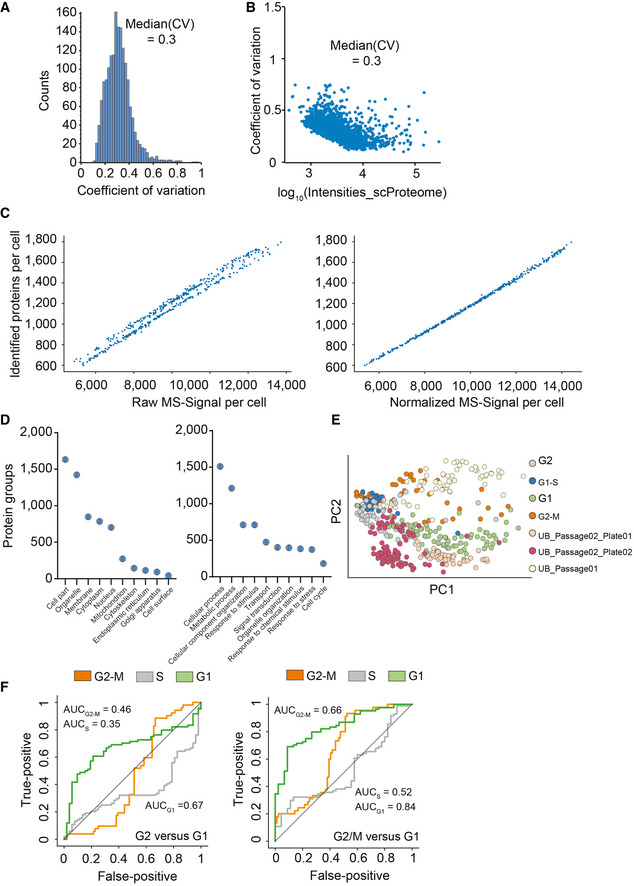
Figure EV2. True single‐cell proteomics data set description.

- Frequency plot for coefficient of variation occurrence within the 420 single‐cell proteomics data set.
- Protein log10 intensity versus coefficient of variation.
- Raw log(x + 1)‐transformed intensity values of proteins per cell plotted against the number of identified proteins per cell (Left) and after normalization by local regression to cancel out those differences to enable downstream analysis (Right).
- Principal component analysis of cell cycle stage enriched single‐cell proteomics measurements and three cell culture batches projected on top.
- Category count of gene ontology annotations for cellular compartment and biological process terms. Exemplary, category count terms are shown for the cellular compartment (Left) and biological process (Right) for more than 430 single‐cell proteomics data set.
- Cell cycle stage prediction for G2 versus G1 phase cells (Left) and G2/M versus G1 phase cells (Right) using the 60 topmost differentially expressed proteins reported by Geiger and coworkers (Aviner et al, 2015) as input.
