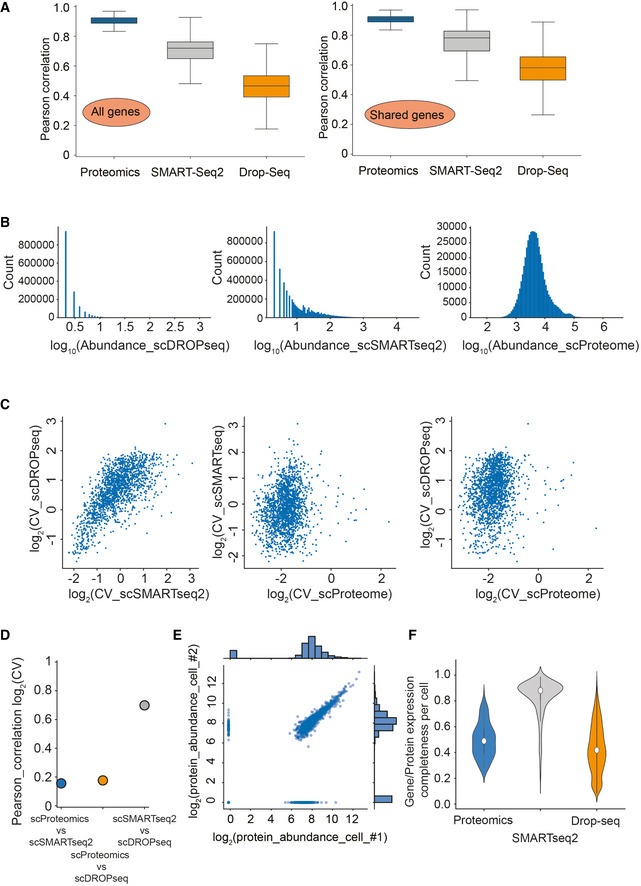
Figure EV4. Correlation and gene/protein completeness analysis of single‐cell transcriptome sequencing and our LC–MS‐based single‐cell proteomics data set of the same cell line.

- Pearson correlation of observations for each cell within each of the technologies on all genes (MS‐based proteomics, SMART‐Seq2 RNA sequencing, and droplet‐based RNA sequencing; Left) and for each cell within each of the technologies on shared genes between technologies (MS‐based proteomics, SMART‐Seq2 RNA sequencing, and droplet‐based RNA sequencing; Right).
- Gene/Protein expression completeness per cell on all shared genes between the three technologies (scProteomics; SMART‐seq2; and DROP‐seq).
- Gene and protein expression completeness as a function of ranked genes/proteins for all three technologies (Proteomics, DROP‐seq, and SMART‐Seq2). Arrows indicate a bimodal distribution for single‐cell RNAseq data in both technologies, which is absent in proteomics.
- Data completeness across single cells as a function of mean protein abundance for MS‐based single‐cell proteomics and both single‐cell RNA sequencing (Drop‐Seq, SMART‐Seq2). Expected poison dropout distribution shown in red.
- Scatter plot of two independently measured single‐cell proteome expression values.
