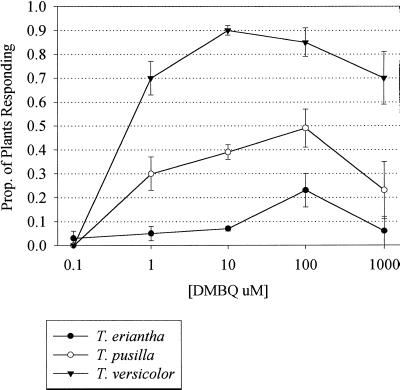
Figure 2.
DMBQ concentration-dependent haustorium formation in Triphysaria species. The graph shows the proportion of plants having at least one haustorium in response to increasing concentrations of DMBQ. se bars were calculated as the square root of P(1 − P)/(N − 1), with P representing the proportion of plants forming haustoria and N representing the number of individuals screened at each concentration.

