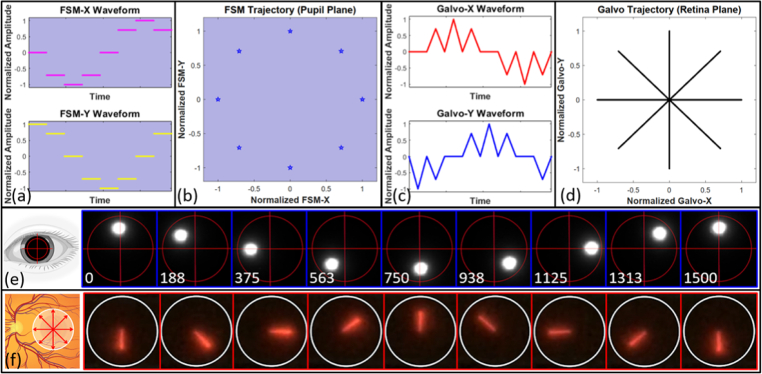
Fig. 4.
(a) Drive signal waveforms of the fast and slow axis of FSM in the spoke-circular scanning pattern. (b) FSM trajectory on the pupil plane. (c) Drive signal waveforms of the fast and slow axis of Galvo in the spoke-circular scanning pattern. The waveforms for both FSM and Galvo were under-sampled along the angular axis for clarity (600 A-scans per B-scan, 2 B-scans per BM-scan, 16 B-scans per volume). (d) Galvo trajectory on the retina plane. (e) The snapshots from the video recording the imaging beam trajectory on the pupil plane. The time intervals of a period were shown in the left bottom of each snapshot (unit: ms). Red circle and crosshair were inserted into video snapshots manually to illustrate the trajectory of the imaging beam. (f) The snapshots from the video recording the entire B-scan on the retinal plane. The infrared light was visualized by the NIR detector card (VRC5, Thorlabs Inc., USA).

