Fig. 6.
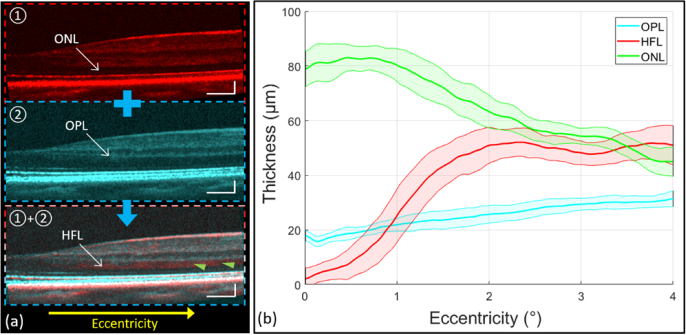
(a) Selected cross-sectional scans acquired by the spoke-circular scanning pattern (“①” with red color coded), the regular spoke scanning pattern (“②” with cyan color coded), and the registration and average of the above cross-sectional scans to emphasize HFL (pointed by the green arrows in “①+②”). (b) The retinal layer thickness along various retinal eccentricities. The mean value (solid lines) and standard deviation (upper and lower bounds of the shaded areas around the solid lines) of each layer were calculated from 300 different spokes in the volume. The green line is the mean of ONL thickness [“①” in (a)] and the cyan line is the mean of OPL thickness [“②” in (a)] measured in images by the regular spoke scanning pattern. The red line is the mean of HFL [“①+②” in (a)] thickness through the registration of cross-sectional scans acquired by both scanning patterns. Scale bars in (a) are 300 µm (horizontally) and 100 µm (vertically).

