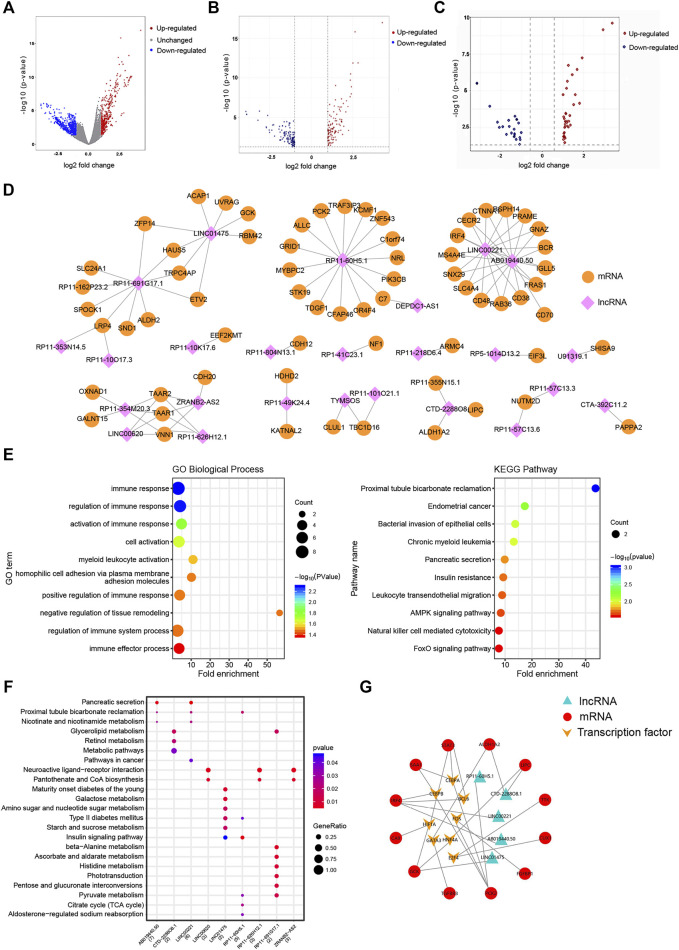
FIGURE 2.
Construction of the DEL–DEM co-expression network and functional analysis. (A) Volcano plots demonstrating differential expression in the cisplatin-sensitive group compared to the cisplatin-resistant group before exon annotation, plotted against -log10 (p-value) in the y axis and log2 (FC) in the x axis. (B, C) Volcano plots demonstrating differential mRNAs and lncRNAs expression, plotted against -log10 (adj. p-value) in the y axis and log2 (FC) in the x axis. The red dots represent upregulated genes, the blue dots represent downregulated genes, and the gray dots represent unchanged genes. (D) DEL–DEM co-expression network containing 91 nodes (25 lncRNA nodes and 66 mRNA nodes) and 99 edges was constructed using Pearson’s correlation analysis. Correlation coefficients >0.5 and p-value < 0.05. (E, F) GO biological process and KEGG pathway enrichment of genes in the DEL–DEM co-expression network. The fold enrichment represents the gene ratio to the background ratio. (G) TF–mRNAs–lncRNAs regulatory network. Red means mRNA; orange means TFs; green means lncRNAs. DELs, differentially expressed lncRNAs; DEMs, differentially expressed mRNAs; TF, transcription factors; GO, gene ontology; KEGG, Kyoto Encyclopedia of Genes and Genomes.

