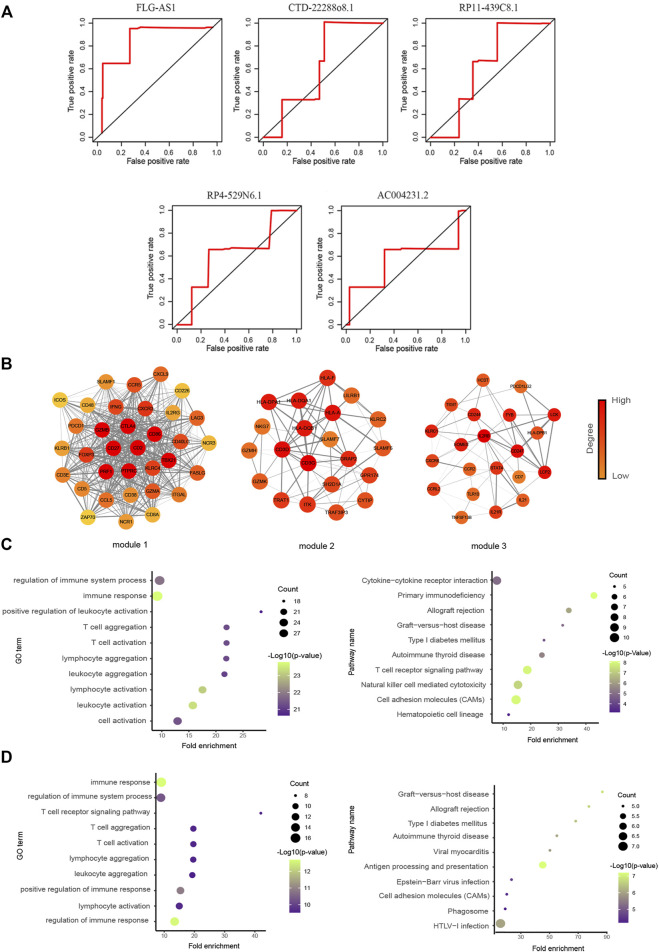
FIGURE 4.
Functional analysis of prognostic lncRNAs. (A) Time-dependent ROC curve analysis of survival-related DELs in diagnosing the 3.5-y survival rate. (The figure showed top five lncRNAs of AUC.) (B) Three significant clusters of the PPI network. The left represents module1 (score = 27.576), the middle represents module2 (score = 7.9), and the right represents module3 (score = 6). (C, D) GO biological process and KEGG pathway enrichment analysis of genes in module1 and module2, the fold enrichment represents the ratio of the gene ratio to the background ratio.

