FIGURE 7.
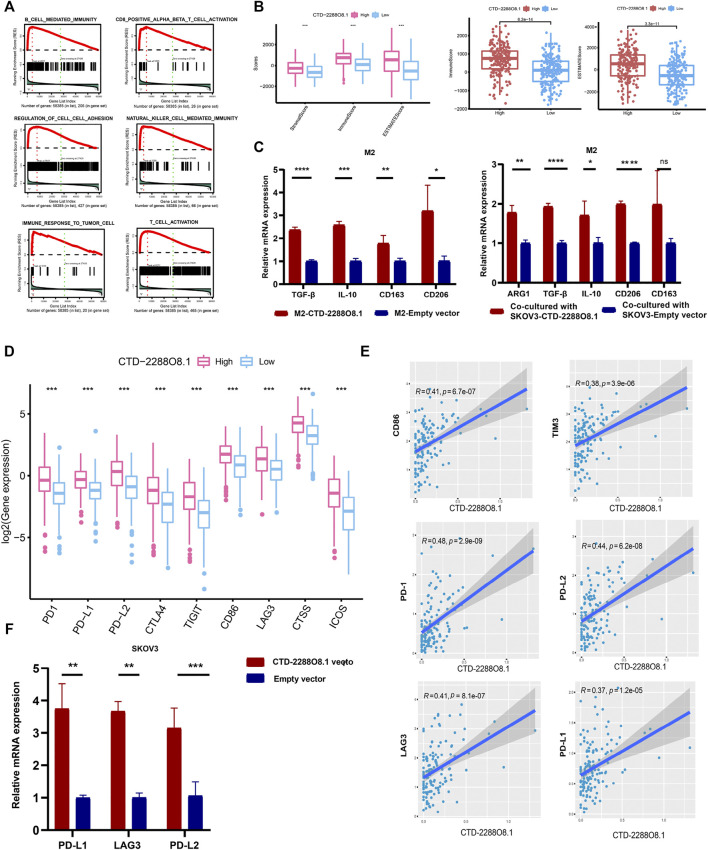
Immunity analyses of CTD-2288O8.1 in OC. (A) Single gene GSEA of CTD-2288O8.1 (GO term and KEGG pathways). (B) Correlation of CTD-2288O8.1 with EstimateScore, ImmuneScore, and StromalScore, Wilcoxon rank sum was applied for the significance test. (C) qRT- PCR showing CTD-2288O8.1 promoted the expression of M2 markers (TGF-β, IL-10, CD163, and CD206) in M2 macrophages (left). Coculture assay showed CTD-2288O8.1 overexpressed in SKOV3 promoted the expression of M2 markers (ARG1, TGF-β, IL-10, and CD206) in M2 macrophages (right). (D) Correlation between common inhibitory immune checkpoints and CTD-2288O8.1 high- and low-expression cohorts. (E) Correlation analysis of CTD-22888O8.1 expression and immune checkpoint genes. (F) qRT-PCR showing the RNA level of CTD-2288O8.1 was positively correlated with PD-L1, LAG3, and PD-L2. *p-value < 0.05, **p-value < 0.01, ***p-value < 0.001, and ****p-value < 0.0001.

