. 2022 Feb 15;144(6):061001. doi: 10.1115/1.4053450

Fig. 2.

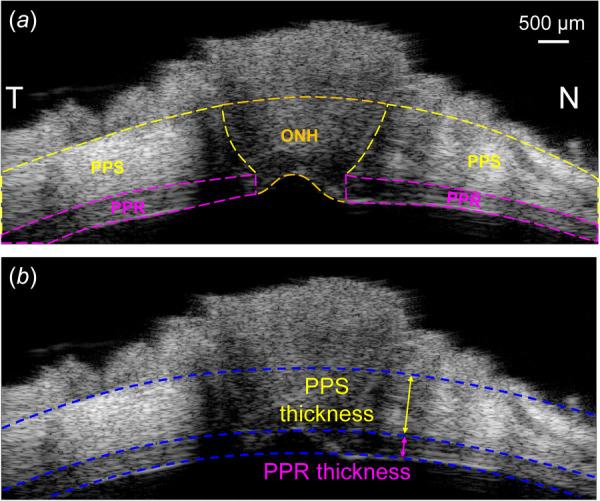
(a) A representative ultrasound image of the scanned region along the nasal-temporal (NT) axis. PPR, ONH, and PPS are manually segmented. (b) Circle fitting of the posterior PPS, posterior PPR, and anterior PPR boundaries. PPR and PPS thicknesses are calculated as the difference in radii between adjacent circles.

(a) A representative ultrasound image of the scanned region along the nasal-temporal (NT) axis. PPR, ONH, and PPS are manually segmented. (b) Circle fitting of the posterior PPS, posterior PPR, and anterior PPR boundaries. PPR and PPS thicknesses are calculated as the difference in radii between adjacent circles.