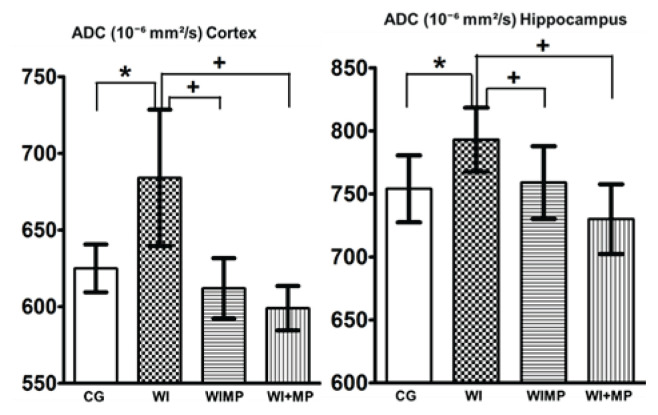
Fig. 4.
Mean apparent diffusion coefficient (ADC) values in Cortex and Hippocampus. Columns with average value ± SD, white columns: control group (intact animals, no WI), checkered columns: groups after edema induction by WI, horizontally striped columns: groups WIMP – edema induction by WI and MP administration intraperitoneally, vertically striped columns: groups WI + MP – edema induction by WI and MP administration into carotid artery. (*) denotes statistically significant difference (p<0.05) from CG group, (+) denotes statistically significant difference (p<0.05) from WI group at the same time interval.

