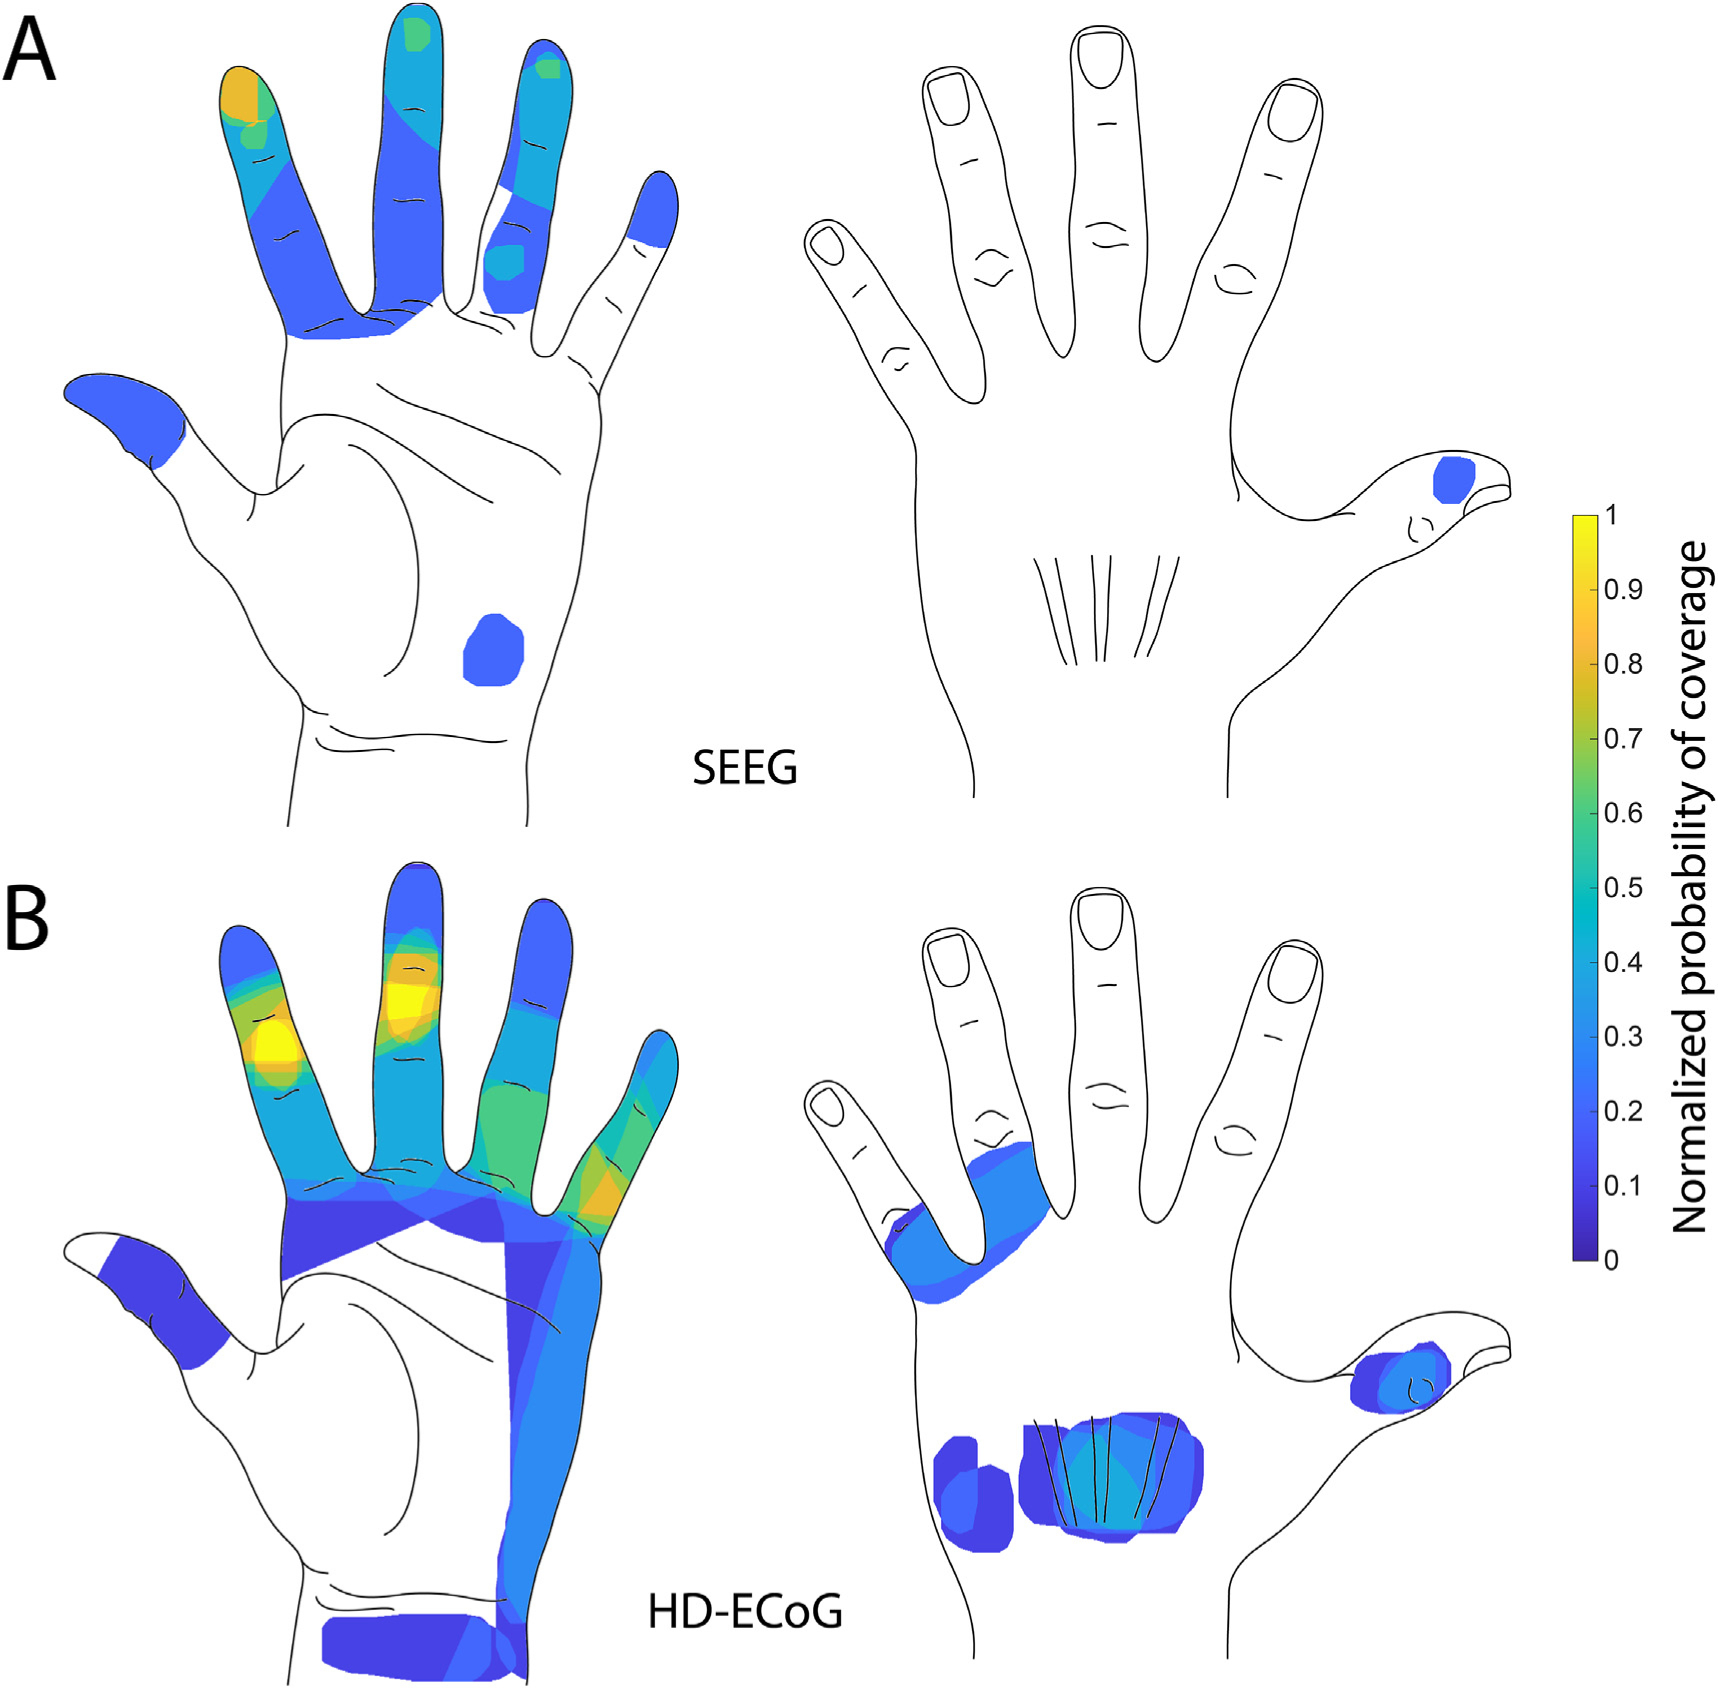
Fig. 4. Heatmap of evoked percepts.

A. Heatmap shows frequency of any region of the hand being part of a sensory percept evoked by S1 sulcal stimulation pooled from both participants. B. Heatmap shows frequency of any region of the hand being part of a sensory percept evoked by S1 gyral stimulation pooled from both participants. Number of percepts covering a region of the hand were normalized to the maximal number of percepts covering any area of the hand (n = 5 for SEEG; n = 10 for HD-ECoG).
