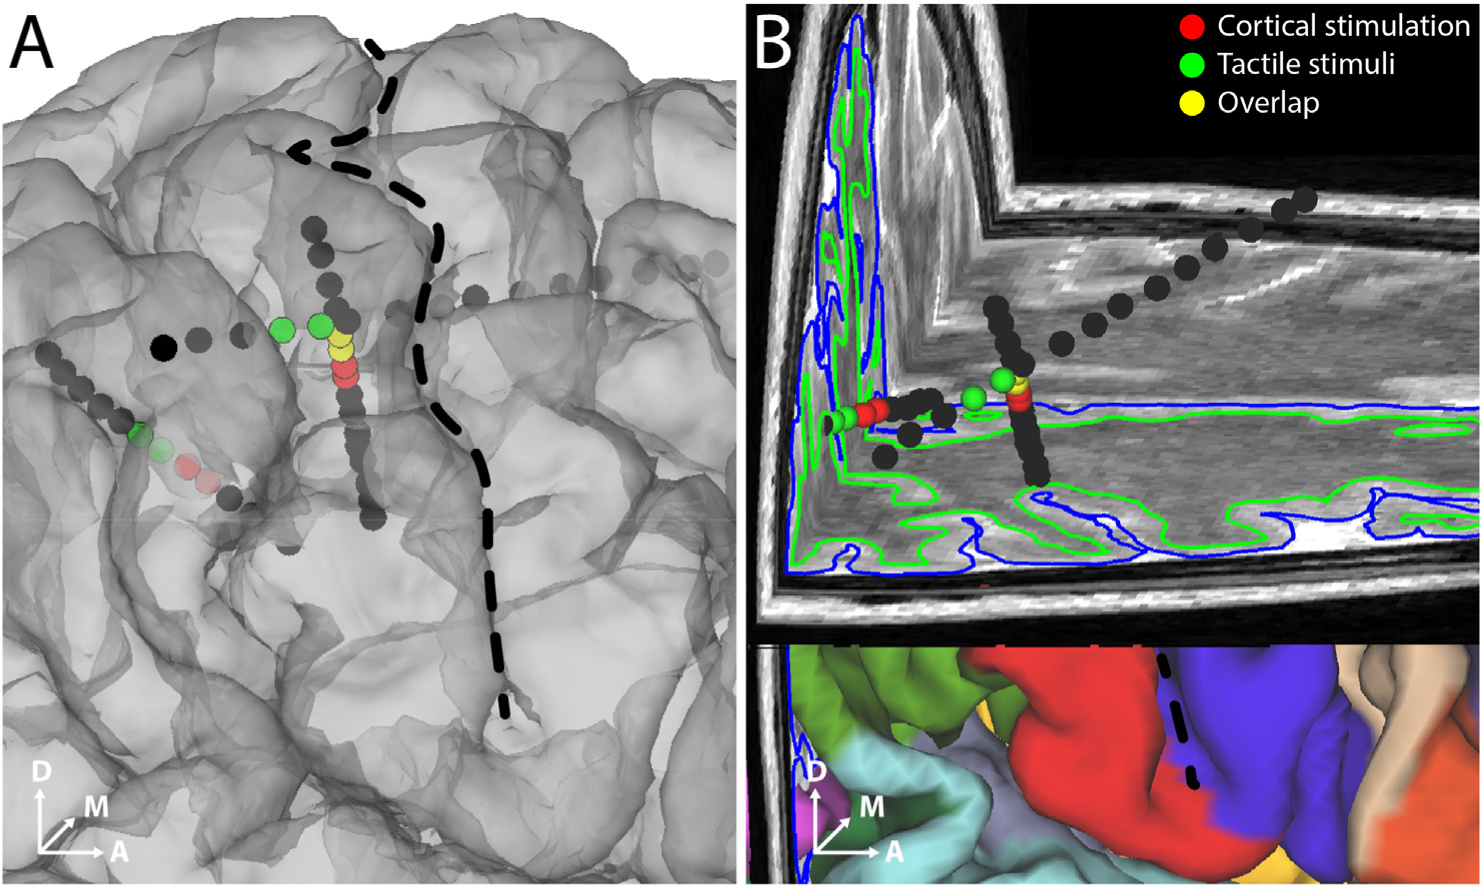
Fig. 5. Recorded neural activity correlated with tactile stimulus of fingertips in participant 2.

A and B. Electrodes that showed high degree of repeatability (r > 0.6) of features across mechanical tactile stimulation cycles are shown (green spheres). The electrodes that evoked a percept in the hand area are also shown (red spheres). Overlapping electrodes are shown in yellow. Black dashed line denotes the central sulcus. B. shows a 3D brain slice showing the same SEEG electrodes.
