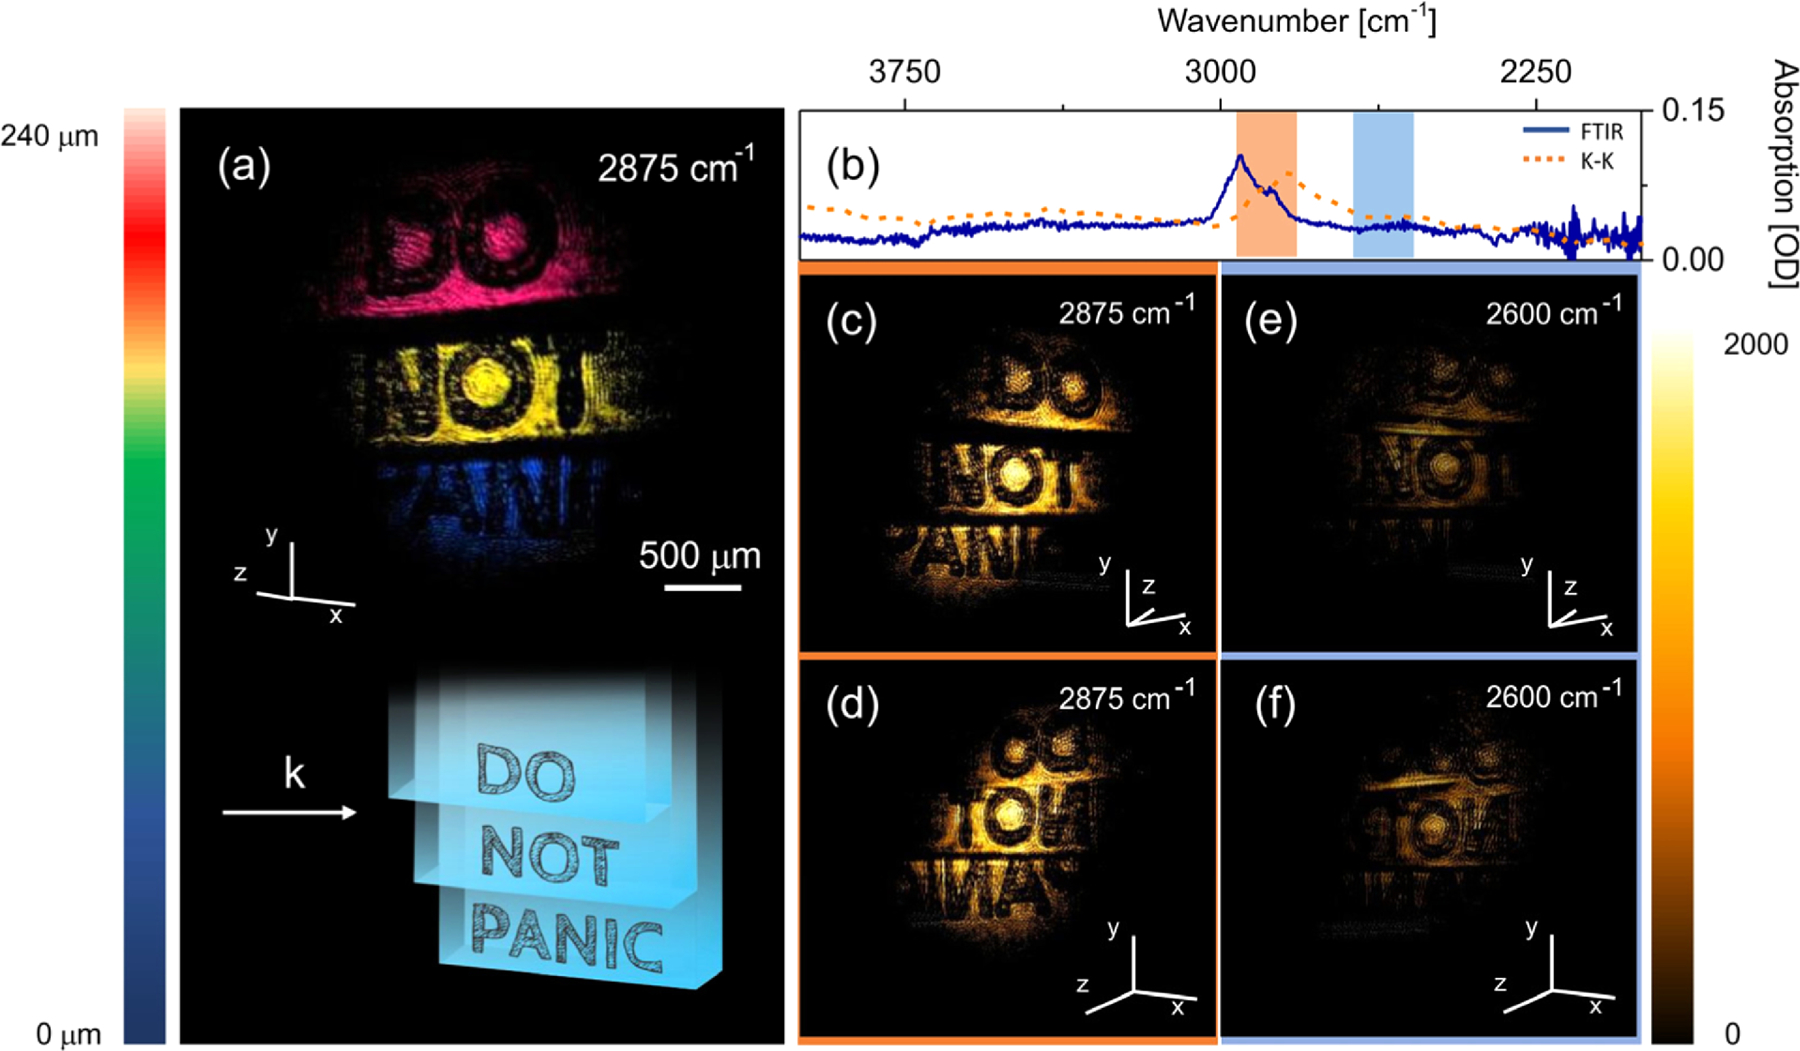
Fig. 4.

3D imaging of stacked cellulose acetate sheets with printed letters. (a) 3D reconstruction of the structure. (b) FTIR transmission spectrum of cellulose acetate (blue line) and real part of the refractive index obtained through a Kramers–Kronig transformation (orange dotted line). Rectangles represent Gaussian pulse width of ∼150 cm‒1. (c) and (d) 3D imaging at 2875 cm‒1; (e) and (f ) 3D imaging at 2600 cm‒1. Total image acquisition time is 1 s.
