
Fig. 1.
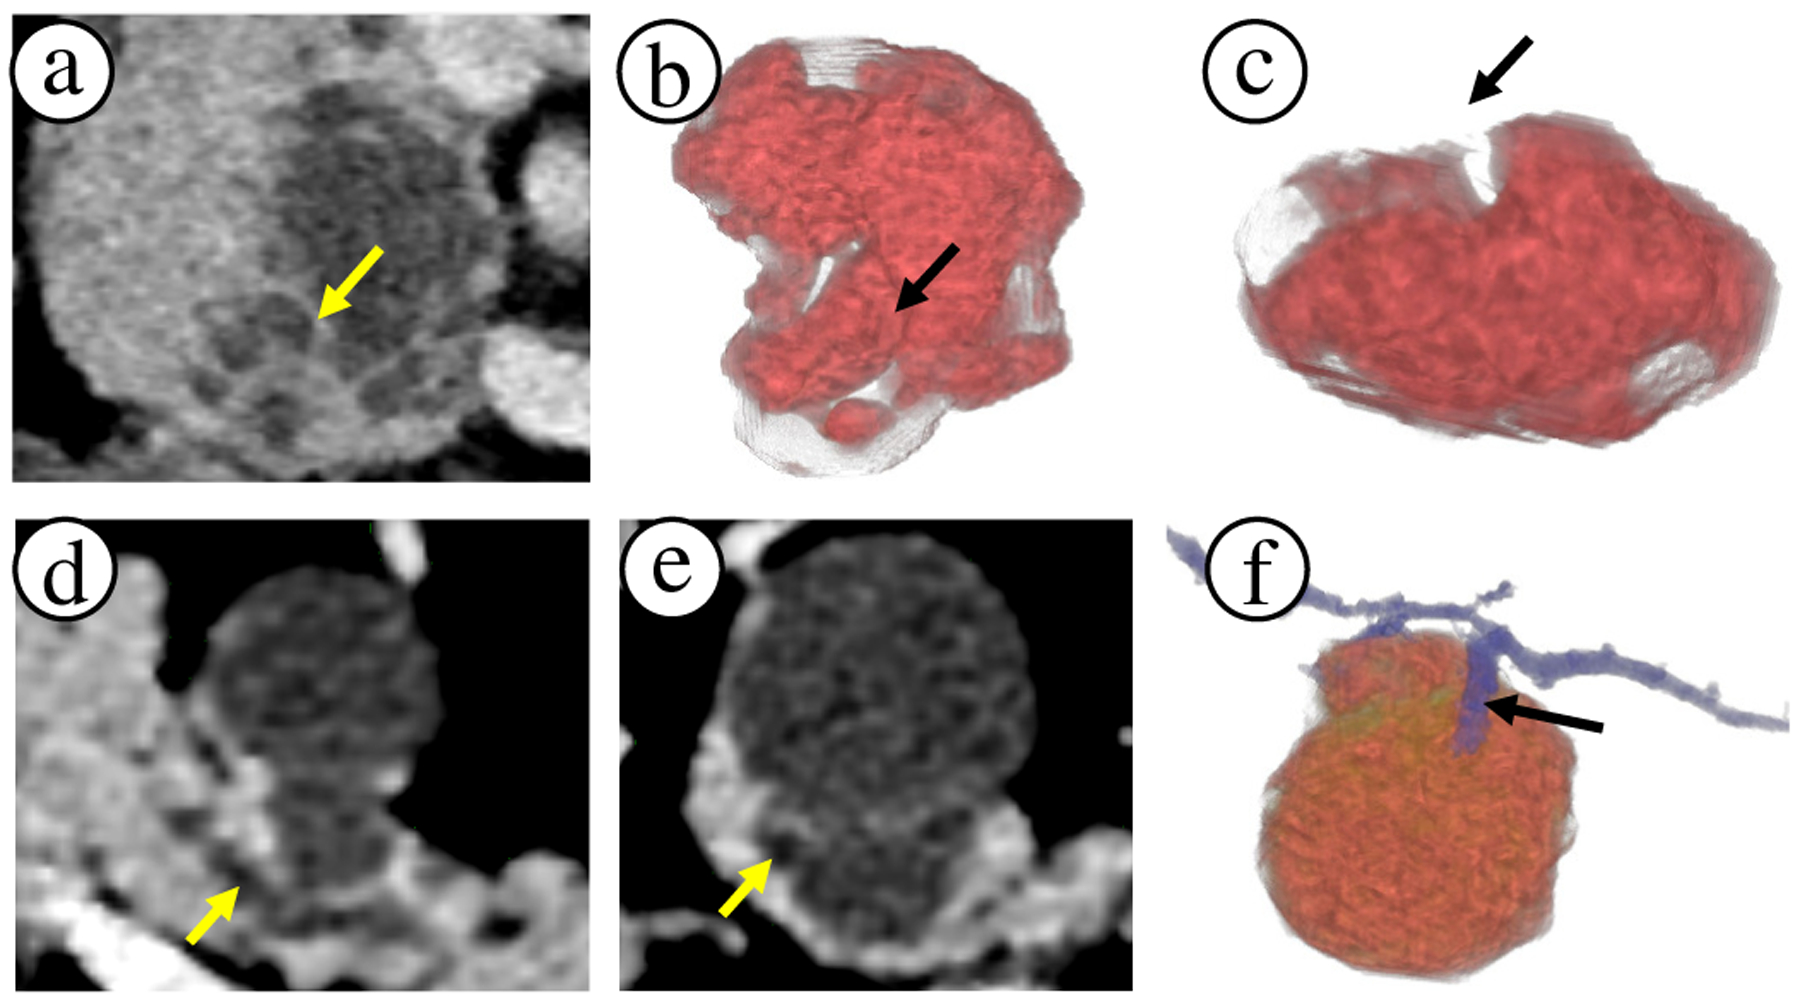
Comparison of 2D slice views to 3D visualizations. (a) Axial slice of a lesion on pancreas head with apparent internal lesion septation wall (see arrow). (b)-(c) The same region can be external crevice rather than an internal septation wall. Thus, 3D visualizations reveal important shape and size information of the lesion cystic components, which can impact the diagnosis. (d) Axial slice of a lesion and primary duct (arrow) in the pancreas body. (e) Secondary duct that connects to the lesion appears very subtle on the slice view (arrow). (f) 3D visualization clearly shows the branching secondary duct connecting with the lesion. 3D visualizations can draw attention to such subtleties.