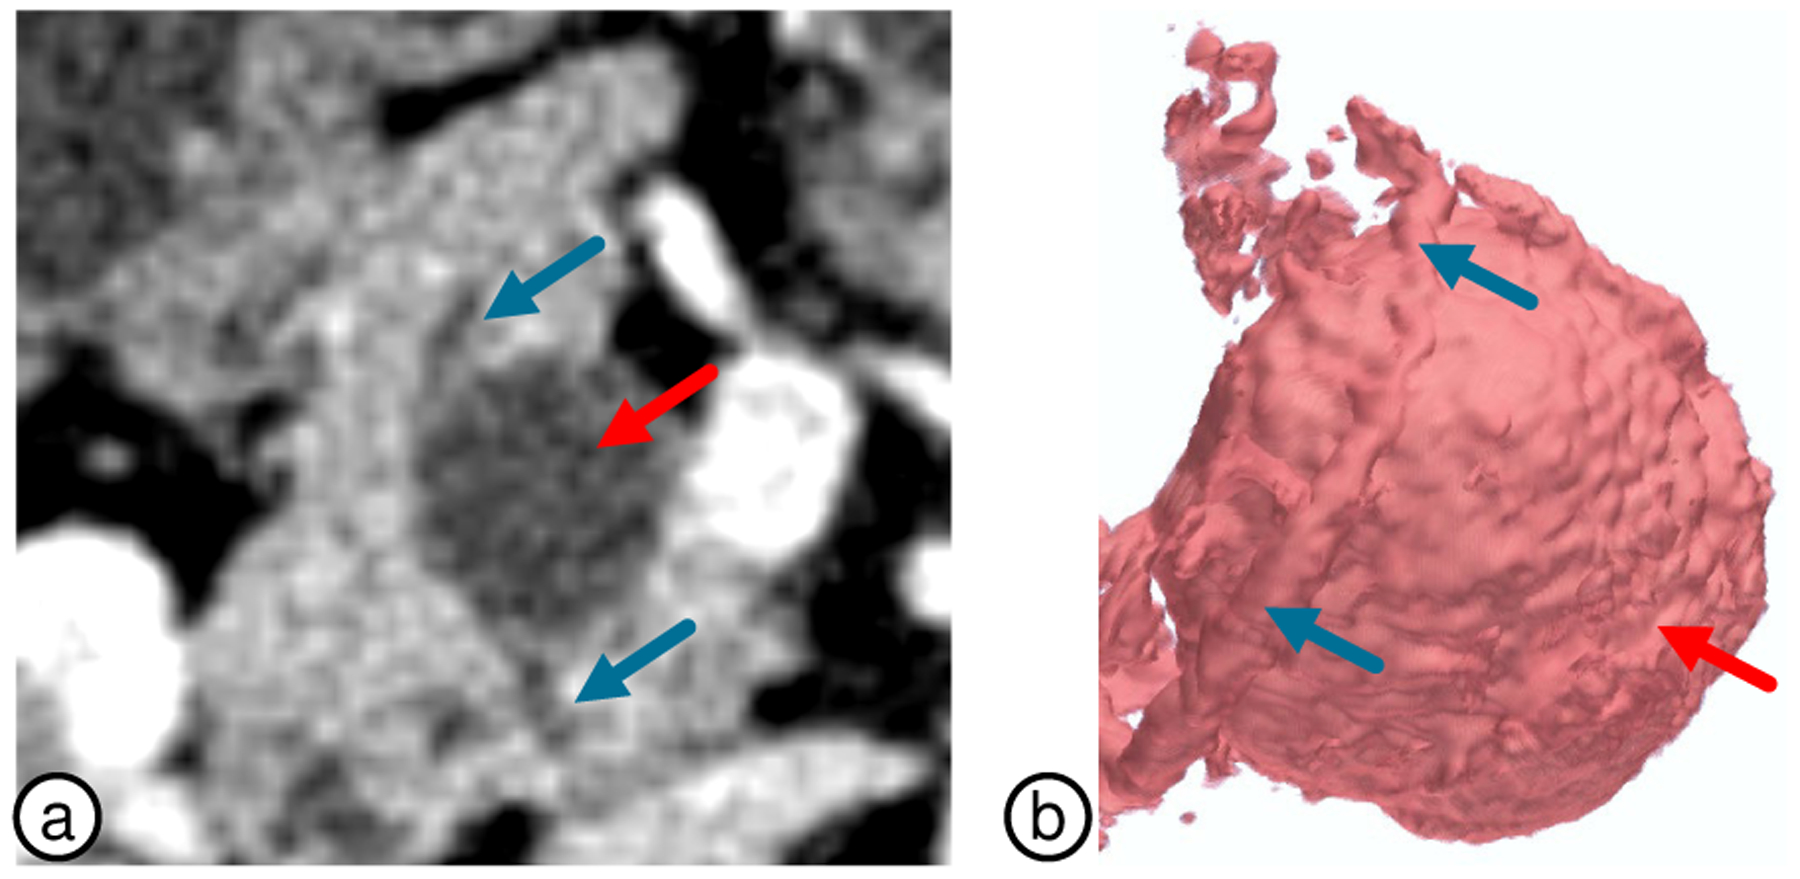
Fig. 15.

Case VP018. (a) 2D axial view of the main duct (blue arrows) and the lesion (gray circular region, red arrow). It was hard for the radiologist to discern whether the duct is adjacent or enters the lesion. (b) 3D visualization clearly shows the main duct (blue arrows) touching the lesion (red arrow), but passes around without entering it.
