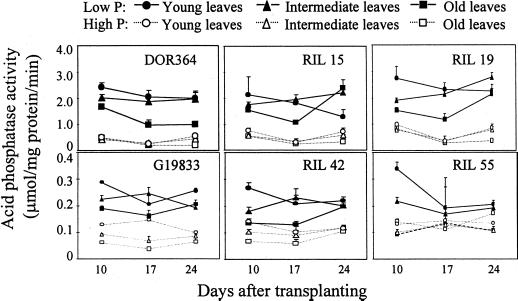
Figure 6.
Chronological changes in APA in young (the first half-expanded trifoliate from the apical meristem), intermediate (fully expanded trifoliates), and old leaf (primary leaf) tissues of the two parental genotypes and related RILs. Plants were grown in nutrient solutions with low (2 μm) and high (1,000 μm) phosphorus availability. Each point represents the mean and se of three replicates. Note that the scale of the figures is different between the upper and lower groups. F values from ANOVA: genotype 479 (P < 0.001), phosphorus level 73 (P < 0.001), leaf type 30 (P < 0.001), harvest 14 (P < 0.001), and genotype × phosphorus level × leaf type 5.6 (P < 0.001).

