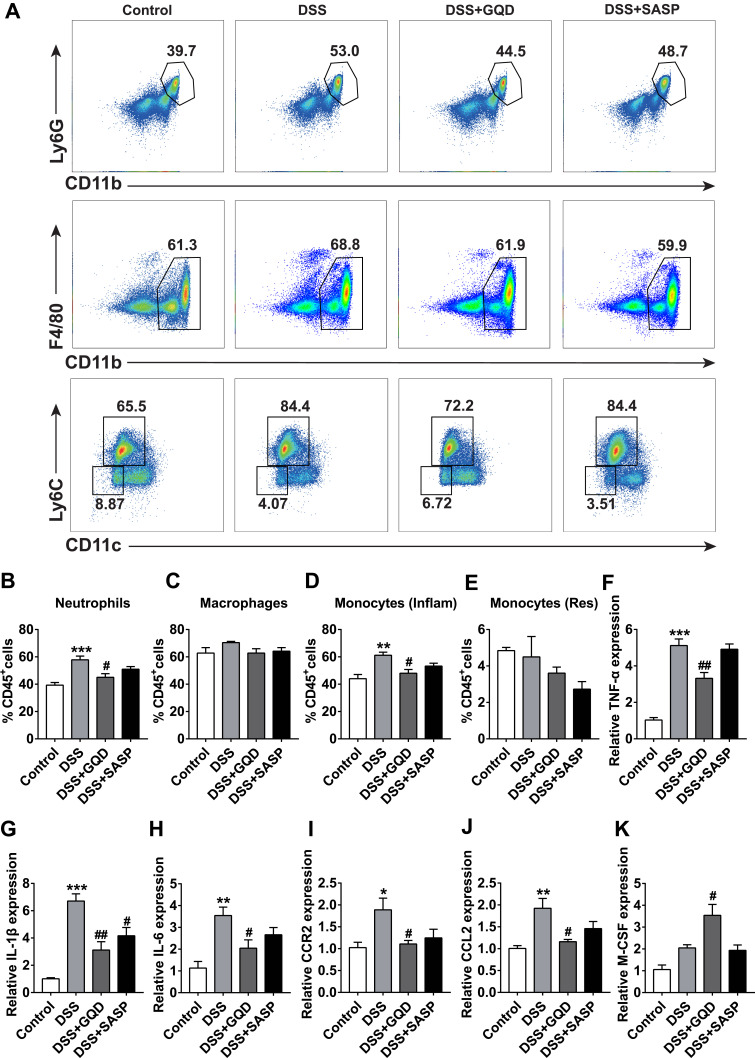
Figure 6.
Myeloid cell populations and cytokines in the lung among different groups. (A) Representative gating strategies for identifying myeloid cells in the lung quantified by flow cytometry. Neutrophils were identified as CD45+CD11b+Ly6G+ cells, macrophages as CD45+CD11b+F4/80+ cells, inflammatory (Inflam) monocytes as CD45+CD11b+CD11c−Ly6Chi cells, and tissue resident (Res) monocytes as CD45+CD11b+CD11c−Ly6Clo cells. The proportion (% CD45+ cells) of neutrophils (B), macrophages (C), inflammatory (Inflam) monocytes (D), and monocytes (Res) (E). The mRNA relative expressions of inflammatory cytokines including TNF-α (F), IL-1β (G), IL-6 (H), CCR2 (I), CCL2 (J), and M-CSF (K) in pulmonary tissues assessed by RT-qPCR. Data were expressed as mean ± SEM (n = 4–8). *P < 0.05, **P < 0.01, ***P < 0.001, compared with the control group; #P < 0.05, ##P < 0.01, compared with the DSS group.

