Figure 9.
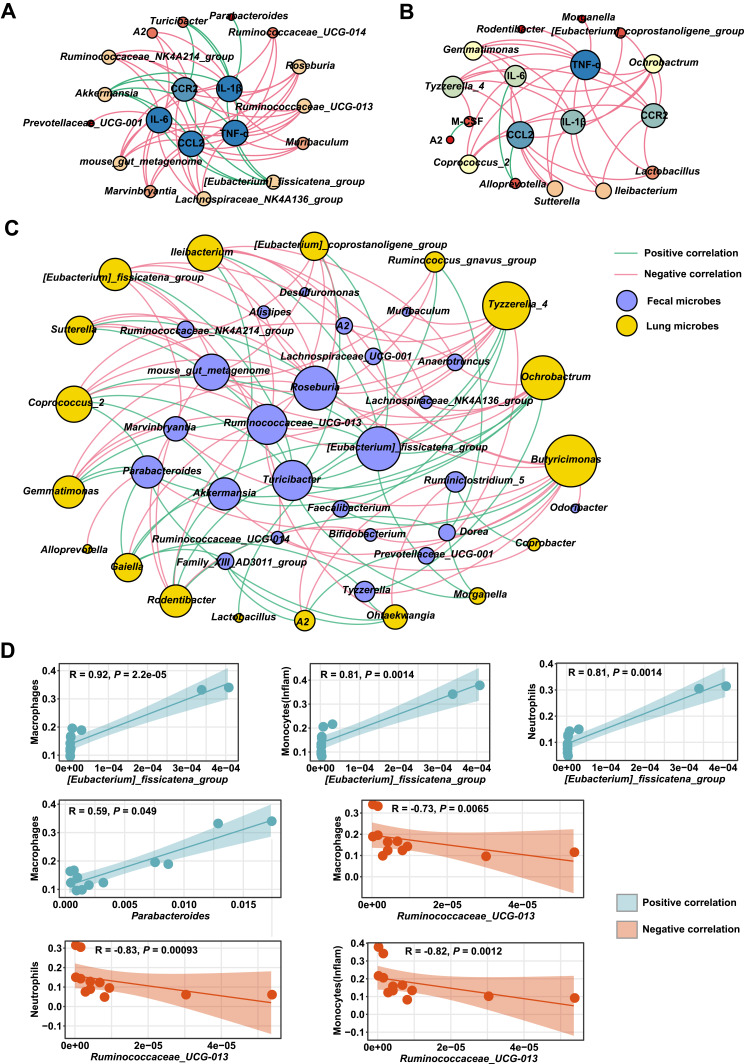
Correlation of specific microbes with inflammation responses affected by DSS and GQD treatments. Network plots of differentially abundant genera (represented by nodes) that are significantly associated with inflammatory cytokines and chemokines in the colon (A) and lung (B). (C) Network plot of the correlations between colonic and lung key microbes. Spearman correlation coefficients were determined using the “psych” package in R (version 3.3.1). A positive correlation between nodes is indicated by green connecting lines, but a negative correlation by pink. Spearman correlations with the P value of more than 0.05 were not shown. Gephi (version 0.9.2) was used to visualize these network graphs. (D) Significant associations between key genera and immune cells in the colon were calculated by Spearman correlation pipeline. No significant connections were observed between microbes and immune cells in the lung.

