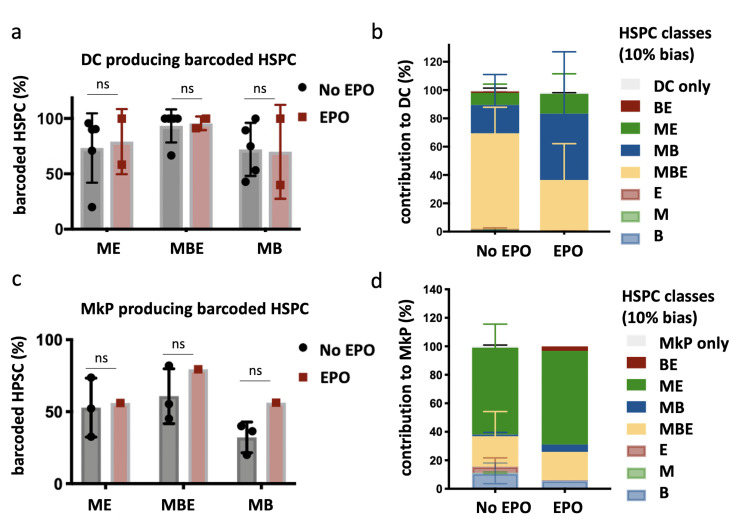
Figure 3. Production of dendritic cells (DCs) and megakaryocyte progenitors (MkP) by hematopoietic stem and progenitor cells (HSPCs) after erythropoietin (EPO) exposure and transplantation.
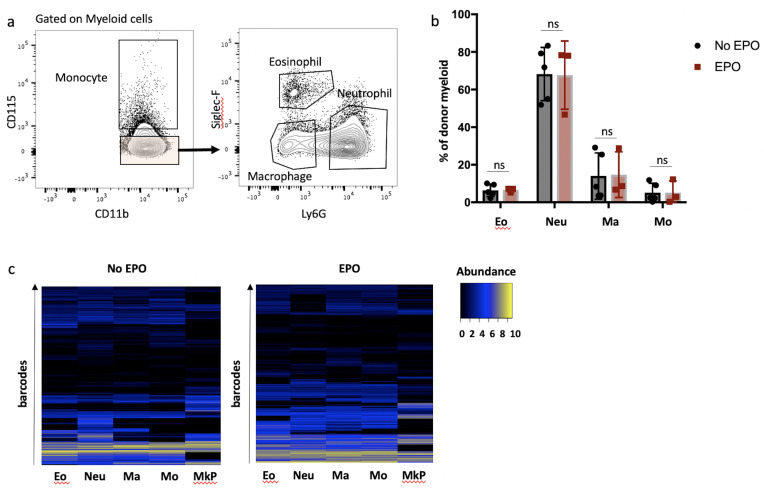
In addition to the analysis of barcodes in the erythroid (E), the myeloid (M), and the B-cell (B) lineage, the DC lineage in spleen and MkP in bone marrow were added. (a) Percentage of barcoded HSPCs producing DC in the different HSPC categories (classification as in Figure 2 based on the M, E, and B lineage only using a 10% threshold; the DC-only category was added). (b) The percentage of the DC lineage produced by the barcodes categorized by bias as in (a). (c, d) Representations as in (a, b) for barcode detection in MkP. Data is derived from a cohort with detailed myeloid sorting. The myeloid lineage was merged according to the percentage of total donor myeloid each subset contributed as in Figure 2—figure supplement 1a to allow classification as in (a, b) based on the M, E, and B lineage only using a 10% threshold. The MkP-only category was added. Shown are values from several animals (a, b, n = 5 for the control group and n = 2 for the EPO group; c, d, n = 3 for the control group and n = 1 for the EPO group [collected over two experiments]). For all bar graphs, mean and SD between mice are depicted. Statistical significance tested using Mann–Whitney U-test p=0.05 for (a, c). Statistical significance tested by permutation test for different subsets in (b) (see Table 1).


