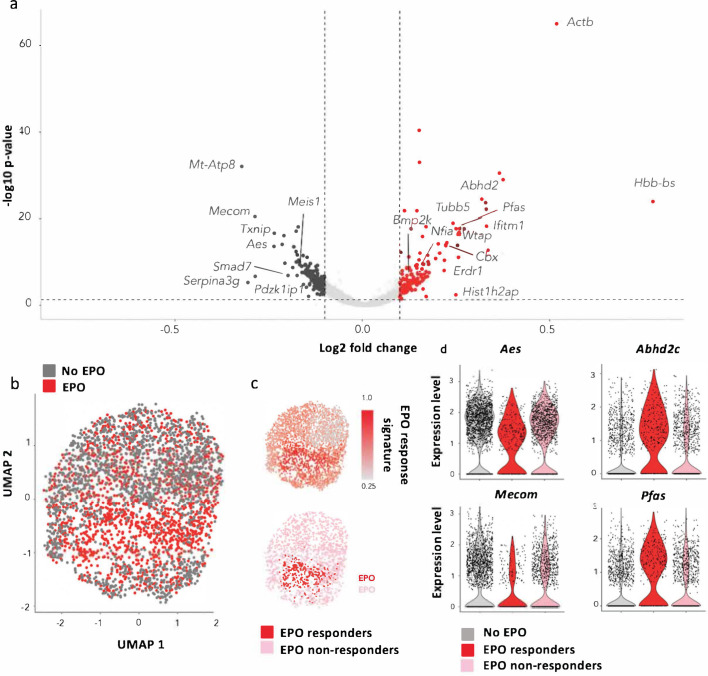
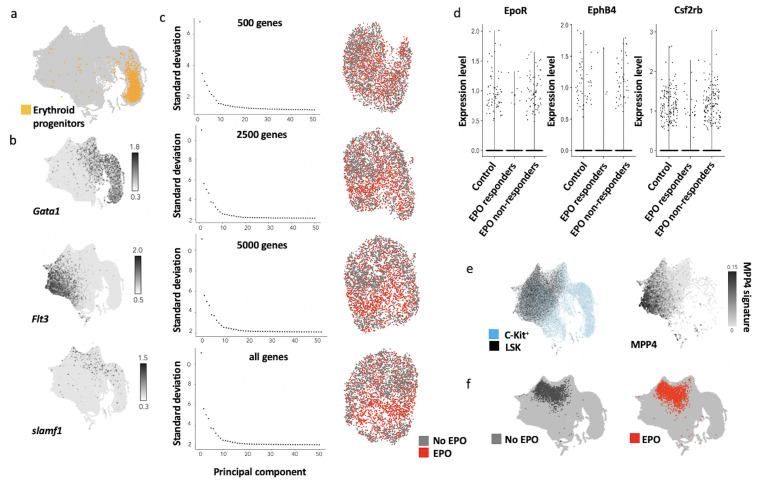
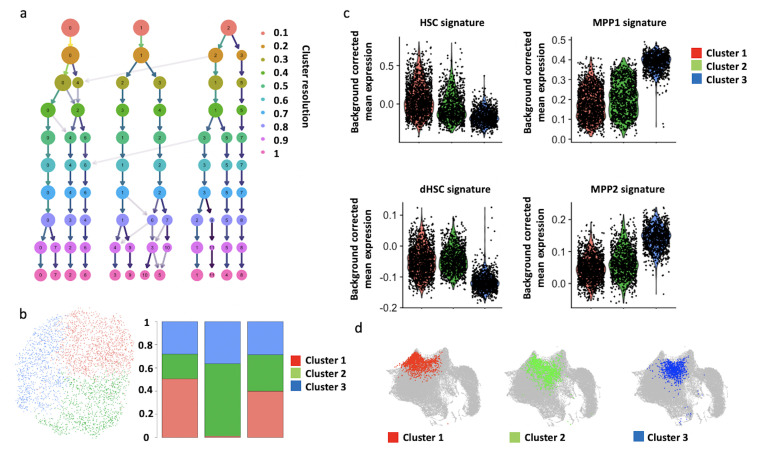
Figure 5. Characterization of erythropoietin (EPO)-exposed hematopoietic stem and progenitor cells (HSPCs) by single-cell RNA sequencing (scRNAseq).
HSPCs were sorted, barcoded, and cultured ex vivo with or without 1000 ng/ml EPO for 16 hr and analyzed by scRNAseq using the 10X Genomics platform. 1706 cells from control and 1595 cells from the EPO group passed quality control. (a) Volcano plot of log2 fold change of the differentially expressed genes between control and EPO-exposed cells versus the adjusted p-value. Genes of interest are annotated. Differentially expressed genes were used to define an EPO response signature. (b) UMAP visualization of the EPO-exposed and control HSPCs. (c) The level of expression in the EPO-exposed HSPCs of the genes in the EPO response signature (top), and definition of the EPO responder and nonresponder subgroups using the 90th percentile expression of the EPO response signature from (c) (bottom). (d) The expression of the indicated genes in the control, EPO responder, and nonresponder subgroups as defined in (c). Genes that are significantly upregulated in the EPO responder group when compared to the control and nonresponder groups. Differential expression was assessed using a logistic regression testing approach, as implemented in Seurat. Figure supplements correspond to one 10× experiment of a pool of eight mice.


