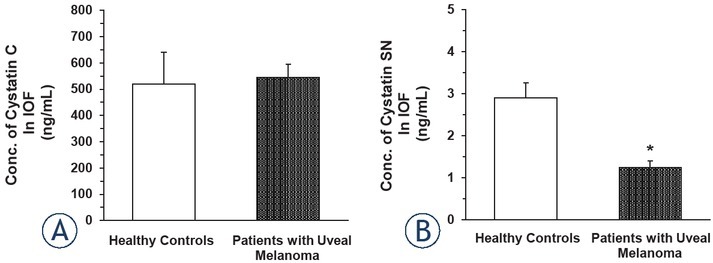
Figure 5.

Concentration of cystatin C (A) and cystatin SN (B) in intraocular fluid of patients with uveal melanoma versus healthy controls. (A) Values represent the mean ± standard deviation (s.d.) of n = 7 healthy controls (mean age = 57.5 ± 1.9 years) and n = 18 of 57 total uveal melanoma patients selected based on an age close to the mean age of the 7 healthy controls (mean age = 55.9 ± 3.2 years; n = 18). (B) Values represent the mean ± s.d. of n = 7 healthy controls (mean age = 57.5 ± 1.9 years) and n = 18 of 57 total uveal melanoma patients selected based on an age close to the mean age of the 7 healthy controls (mean age = 55.9 ± 3.2 years; n = 18).
* = significant difference (p < 0.001) from mean value for healthy controls; IOF = intraocular fluid
