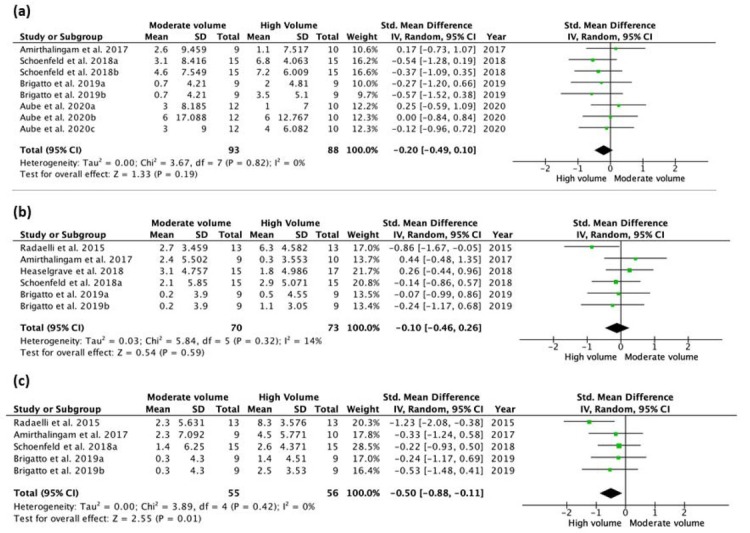
Figure 2.

Forest plot of the comparison between MV and HV for quadriceps femoris measurements (a). Schoenfeld et al. (2019a) – measurements of rectus femoris for MV and HV groups. Schoenfeld et al. (2019b) – measurements of vastus lateralis for MV and HV groups. Brigatto et al. (2019a) – comparison between the MV group and HV1 group vastus lateralis measurements. Brigatto et al. (2019b) – comparison between the MV group and HV2 group vastus lateralis measurements. Aube et al. (2020a) – represents anterior thigh medial muscle thickness measurements. Aube et al. (2020b) – represents anterior thigh distal muscle thickness measurements. Aube et al. (2020c) – represents the sum of both anterior thigh muscle thickness measurements (medial and distal). Forest plot of the comparison between MV and HV for biceps brachii measurements (b). Brigatto et al. (2019a) – comparison between the MV group and HV1 group biceps brachii measurements. Brigatto et al. (2019b) – comparison between the MV group and HV2 group biceps brachii measurements. Forest plot of the comparison between MV and HV for triceps brachii measurements (c). Brigatto et al. (2019a) – comparison between the MV group and HV1 group triceps brachii measurements. Brigatto et al. (2019b) – comparison between the MV group and HV2 group triceps brachii measurements.
