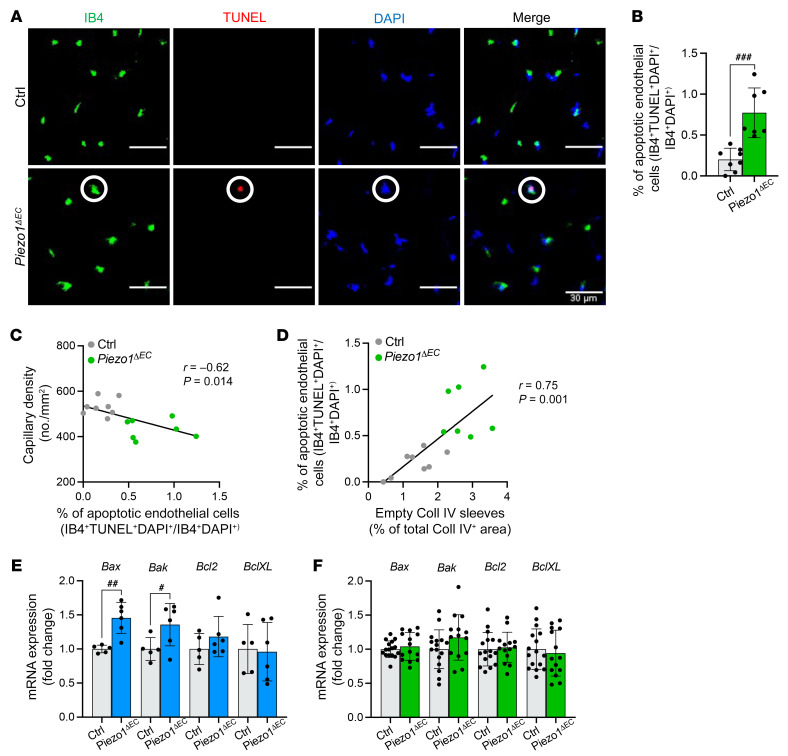
Figure 4. Protection against endothelial cell apoptosis.
(A) Immunohistochemistry for endothelial cells in capillaries (IB4, green), apoptotic cells (TUNEL, red), and nuclei (DAPI, blue) in gastrocnemius muscle sections. Merged images are shown on the right. Scale bars: 30 μm. Superimposed circles highlight an example of an apoptotic endothelial cell (IB4+TUNEL+DAPI+). (B) Quantification of apoptotic endothelial cell percentages in Ctrl and Piezo1ΔEC gastrocnemius muscle using images of the type shown in A. (C) Pearson’s correlation analysis of capillary density and percentage of apoptotic endothelial cells (r = –0.62, P = 0.014). (D) Pearson’s correlation analysis of apoptotic endothelial cell percentage and capillary regression (r = 0.75, P = 0.001). The black lines are the correlation fits. All data are for n = 7 to 8 mice per group (mean ± SD). (E) Quantitative PCR mRNA expression data for proapoptotic markers (Bax, Bak) and antiapoptotic markers (Bcl2, BclXL) in endothelial cells isolated from skeletal muscle of Ctrl (gray) and Piezo1ΔEC (blue) mice. (F) Quantitative PCR mRNA expression data for proapoptotic markers (Bax, Bak) and antiapoptotic markers (Bcl2, BclXL) in whole gastrocnemius muscle of Ctrl (gray) and Piezo1ΔEC (green) mice. RNA abundance was normalized to housekeeping gene expression and is presented as the fold-change relative to that in Ctrl mice. All data are for n = 5 to 6 mice per group for endothelial cells and n = 14 to 16 mice per group for whole muscle (mean ± SD). Superimposed dots are the individual underlying data values for each mouse. #P < 0.05, ##P < 0.01, ###P < 0.001 vs. Ctrl mice. Statistical significance was evaluated using Student’s t test, except in C and D where Pearson’s correlation was used.

