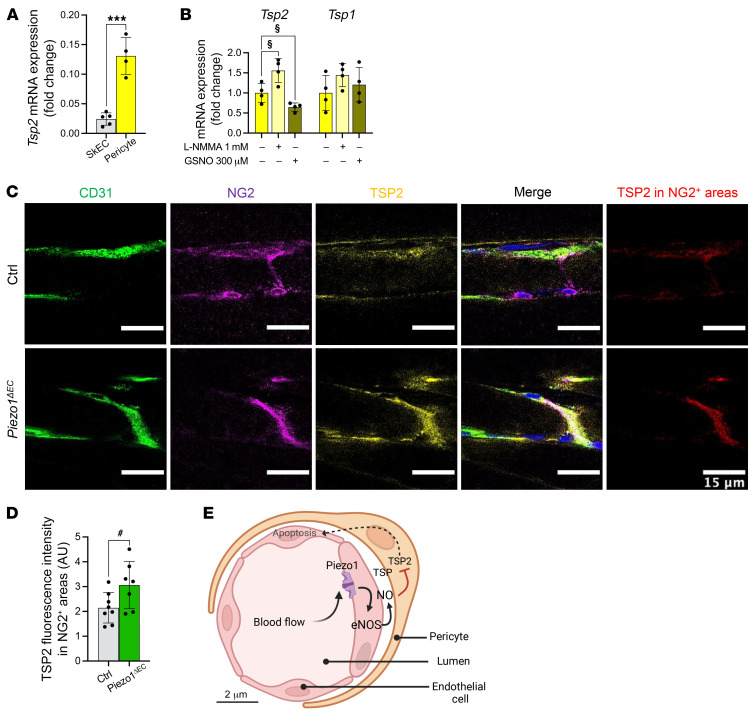
Figure 6. In situ upregulation of TSP2 in pericytes.
(A and B) Relative mRNA abundance for (A) Tsp2 in isolated SkECs (gray) and pericytes (yellow) from WT mice, and (B) Tsp2 and Tsp1 in isolated pericytes from WT mice: untreated (yellow), treated with NO inhibitor (1 mM L-NMMA, light yellow), or with NO donor (300 μM GSNO, dark yellow/green) for 4 hours. mRNA abundance was determined by qRT-PCR, normalized to housekeeping gene expression, and is presented as fold-change relative to isolated SkECs (A) or untreated pericytes (B). (C) Immunohistochemistry for CD31 (green), NG2 (magenta), and TSP2 (yellow) in gastrocnemius muscle longitudinal sections. Merged images are shown on the right. TSP2 fluorescence intensity was measured in NG2+ regions (red). Scale bars: 15 μm. (D) Quantification of TSP2 fluorescence intensity in NG2+ regions corresponding to pericytes. (E) Schematic model of the mechanism. Data are for n = 4 mice per group (A and B) and n = 7 to 8 (C and D) (mean ± SD). Superimposed dots are the underlying data values for each mouse. #P < 0.05 vs. Ctrl mice; ***P < 0.001 vs. WT isolated SkECs; §P < 0.05 vs. untreated WT isolated pericytes. Statistical significance was evaluated using Student’s t test.

