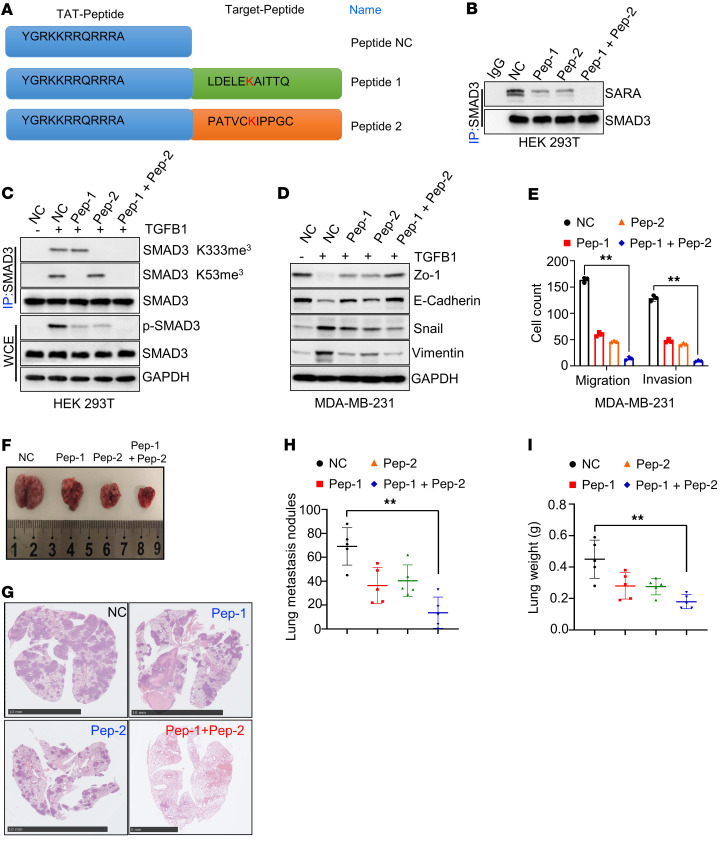
Figure 6. Targeting SMAD3 K53/K333 methylation inhibits cancer metastasis.
(A) The aa sequence of different TAT peptides. (B and C) HEK293T cells were treated with different TAT peptides (Pep-1, Pep-2) and TGFB1 (5 ng/mL), and WCEs were collected for IP with anti-SMAD3 antibody, followed by IB analysis. (D) MDA-MB-231 were silenced with TAT peptides and treated with TGFB1 (5 ng/mL), and WCEs were collected for IB analysis. (E) Quantitative analysis of Transwell cell migration and invasion assays using MDA-MB-231 cells treated with different TAT peptides. (F and G) Representative lung image (F) and H&E-stained lung sections (G). Scale bars: 10 mm. (H and I) Scatter plots show the number of lung metastatic nodes (I) and lung weights (H). All immunoblotting was performed 3 times, independently, with similar results. Data indicate the mean ± SD. **P < 0.05, by 2-tailed Student’s t test.

