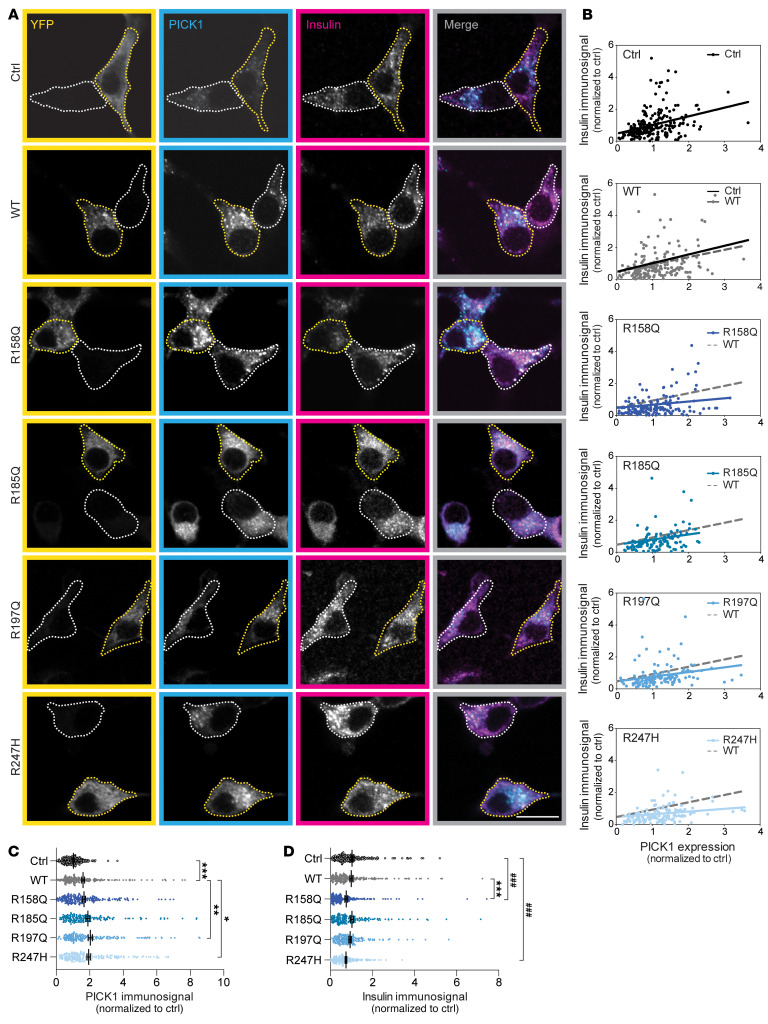
Figure 5. Expression of PICK1-R158Q and PICK1-R247H in INS-1E cells reduces insulin storage.
INS-1E cells were transiently transfected with YFP alone (ctrl) or YFP fused to PICK1 WT, R158Q, R185Q, R197Q, and R247H. (A) Representative confocal images of INS-1E cells immunostained for YFP (yellow), PICK1 (cyan), and insulin (magenta). Merged images show PICK1 and insulin immunosignals. Examples of transfected cells (YFP-positive) are outlined with yellow dotted lines, and untransfected cells are outlined with white dotted lines. Scale bar: 10 μm. (B) Quantified insulin and PICK1 immunosignals per cell correlate and can be fitted with a linear regression. The gray dotted line represents the linear regression for PICK1 WT. Expression of PICK1, R158Q, or R247H reduces the slope of the correlation line. (C) Quantification of the PICK1 immunosignal. R158Q (n = 159), R185Q (n = 119), R197Q (n = 125), R247H (n = 140), ctrl (n = 227) compared with WT (n = 188), with Kruskal-Wallis test followed by Dunn’s multiple-comparison test. Data are shown as mean ± SEM. (D) Quantification of the insulin immunosignal. *P < 0.05, **P < 0.01, ***P < 0.001, PICK1 coding variants compared with WT; ###P < 0.001, variants compared with ctrl; Kruskal-Wallis test followed by Dunn’s multiple-comparison test.

