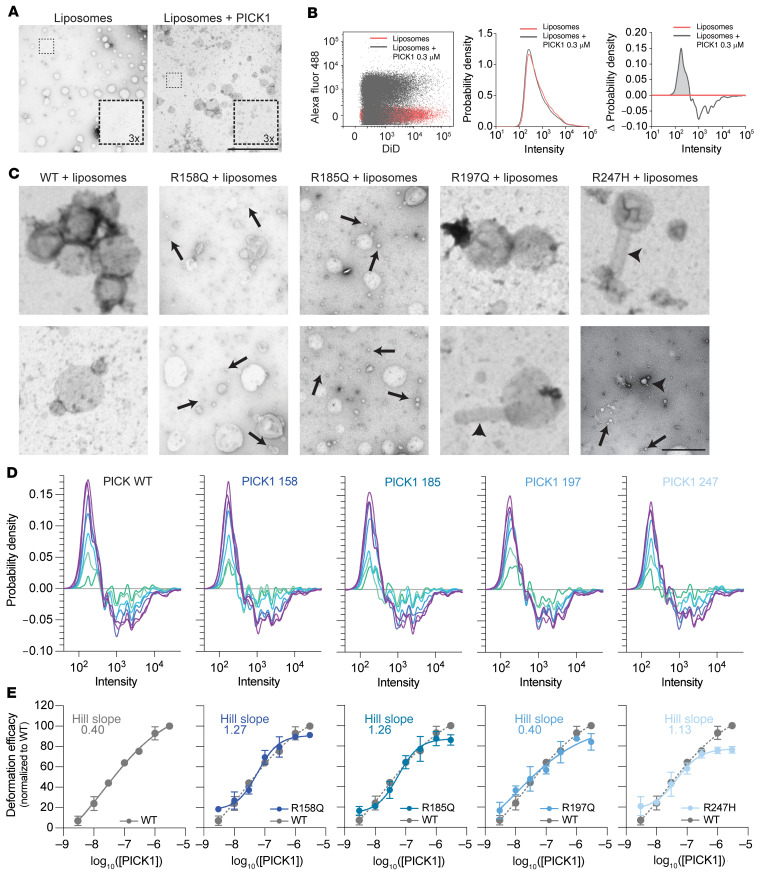
Figure 7. The PICK1 coding variants show increased fission efficacy at lower concentration and altered liposome deformation.
(A) Representative negative-stain TEM images. Left: Liposomes alone. Right: Liposomes incubated with 0.3 μM PICK1. Scale bar: 2 μm. (B) Left: Representative 2-parameter scatter plot of primary data output from the flow cytometer showing fluorescence intensities (in AU) of Alex Fluor 488 (PICK1) versus DiD (liposomes) for samples containing liposomes (red) or liposomes incubated for 1 hour with 0.3 μM AF488 PICK1 (gray). Center: Probability density distribution of DiD intensities extracted from the scatter plot (left), showing the size distribution of DiD-labeled liposomes prior to incubation with PICK1 (red) and liposomes incubated for 1 hour with 0.3 μM Alexa Fluor 488–PICK1 (gray). Right: Change in density distribution after 1 hour of incubation (gray) (kernel density estimations of DiD fluorescence normalized to control). (C) Representative negative-stain TEM images of liposomes incubated with PICK1 WT and the PICK1 coding variants for 1 hour. Arrowheads indicate tubular structures, while arrows point to small liposome structures. Scale bar: 1 μm. (D) Representative results of flow cytometry experiments show the changes in density distribution of liposomes (kernel density estimations of DiD fluorescence normalized to control) upon incubation (1 hour) with PICK1 WT and the PICK1 coding variants at a concentration range of 0.003–3 μM as a measure of liposome fission efficacy. (E) Liposome fission efficacy quantified as the area under the curve of normalized kernel density estimations of DiD fluorescence for a concentration range from 0.003 to 3 μM for PICK1 and the PICK1 coding variants. The points were fitted to a sigmoidal standard curve: the respective Hill slopes are shown in each plot.

