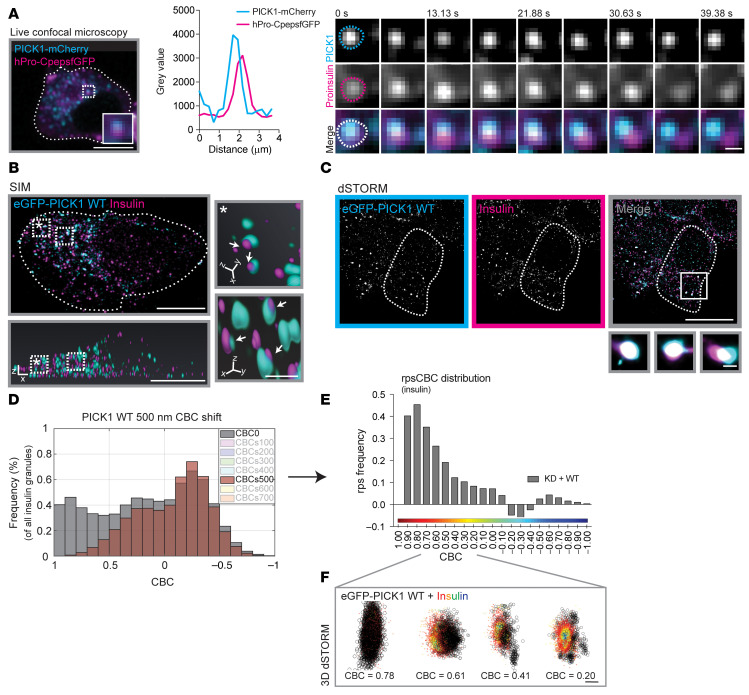
Figure 8. PICK1 resides transiently on insulin ISGs before budding off.
(A) GRINCH cells were transiently transfected with PICK1-mCherry. Representative GRINCH cell shows a colocalized hPro-CpepsfGFP (magenta) and PICK1-mCherry (cyan) cluster, indicated by the dotted square, with the inset (30% zoom) highlighting the overlap. Scale bar: 10 μm. Right: Profile plot from the inset and time-lapse images of the merged Z-stack (500 nm) during steady-state conditions (11 mM glucose). Time is in seconds. Upper 2 rows present a PICK1-mCherry cluster and hPro-CpepsfGFP cluster, respectively, both shown in gray scale. The third row shows merge images. Time is in seconds. Scale bar: 1 μm. (B and C) INS-1E cells transduced with KD + WT and immunostained for eGFP-PICK1 (cyan) and insulin (magenta). (B) Representative SIM image of INS-1E cells. Bottom: 3D reconstruction. Scale bar: 5 μm. Right: Insets with higher-magnification images of overlapping PICK1 and insulin granules (arrows) in 3D. Scale bar: 500 nm. (C) Representative dSTORM image of INS-1E cells. Scale bar: 5 μm. Bottom: Insets with higher-magnification images of overlapping PICK1 and insulin granules. Scale bar: 250 nm. (D) Insulin CBC shift analysis. PICK1 clusters shifted +500 nm in the x direction, and the CBC distribution of the insulin granules was recalculated (brown) and overlaid on the original CBC distribution (gray). (E) The difference in CBC between the original from B (gray) and the +500 nm shift (brown). We refer to this as rpsCBC distribution. Note that many points are not assigned CBC values (NA) when shifted. n = 5 individual experiments. (F) The 3D images display distinctive colocalized clusters of insulin (colored by CBC scale) and eGFP-PICK1 (black), ordered by CBC values ranging from 0.78 to 0.20 and indicative of PICK1 fission from insulin granules. Scale bar: 200 nm.

