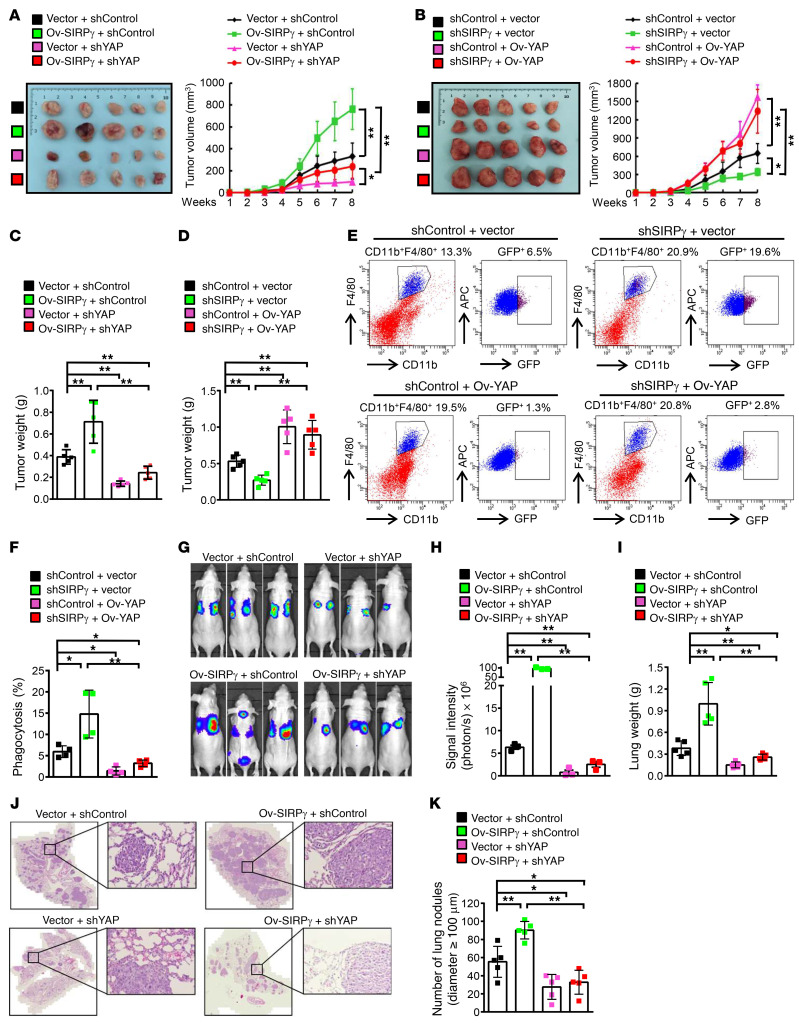
Figure 8. The SIRPγ/YAP axis promotes tumor growth and metastasis.
(A and B) A549-xenograft growth of indicated groups (1 × 10⁶ inoculated cells/mice, n = 5 mice per group). (C and D) A549-xenograft weight of indicated groups. (E and F) Phagocytosis in A549 xenografts, represented by the percentage of GFP+F4/80+CD11b+ cells in total F4/80+CD11b+ cells. (G and H) A549 lung metastasis of indicated groups (1 × 10⁵ tail vein–injected cells per mouse). (I) Lung weight of indicated groups. (J) H&E staining of lung sections from indicated groups. Scale bars: 3000 μm and 50 μm (zoomed-in images on right). (K) The number of metastatic lung nodules of indicated groups. Cells were injected into the lateral tail vein of 6-week-old female nude mice (1 × 10⁵ cells per mouse, n = 5 mice per group). All experiments were carried out at least in triplicate and the data are presented as the mean ± SD. *P < 0.05; **P < 0.01 by 1-way ANOVA.

