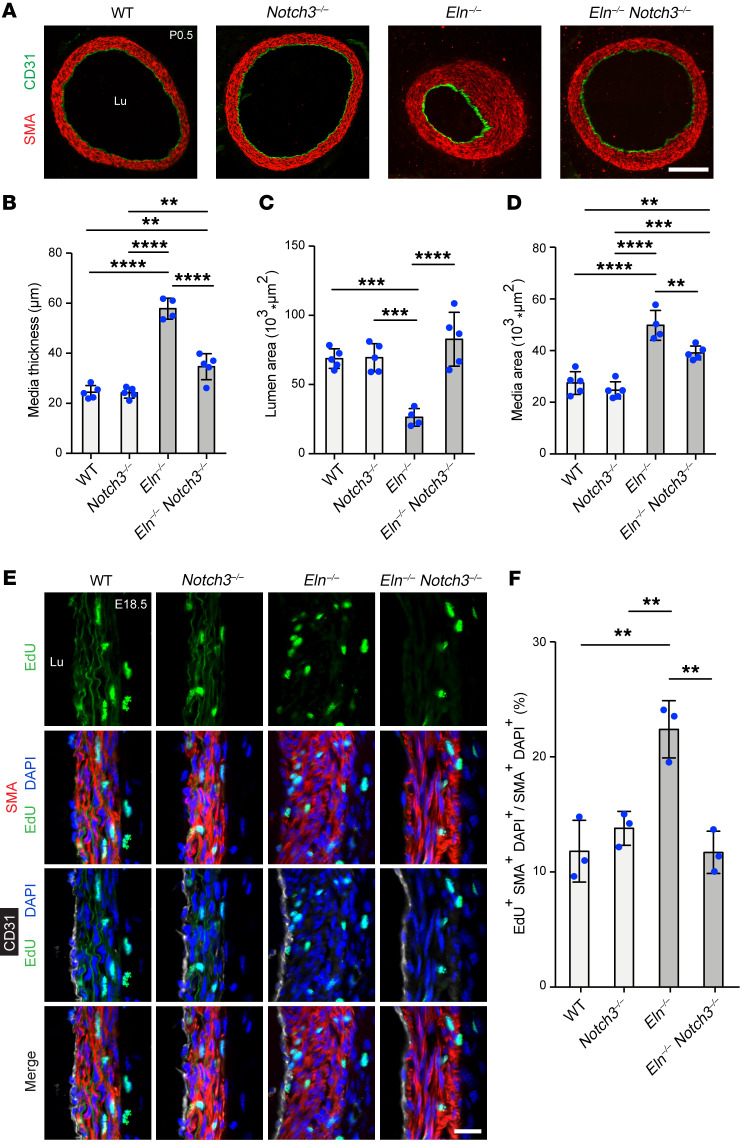
Figure 6. On the Eln–/– background, Notch3 deletion attenuates hypermuscularization and stenosis and reduces SMC proliferation.
(A) Transverse sections of the ascending aorta from pups at P0.5 of indicated genotype were stained for SMA (SMC marker) and CD31 (EC marker). Lu, lumen. Scale bar: 100 μm. (B–D) Histograms represent medial thickness (B), lumen area (C), and medial wall area (D) of ascending aortas from A. n = 4 to 5 mice. **P < 0.01; ***P < 0.001; ****P < 0.0001 by 1-way ANOVA with Tukey’s post hoc test. (E) EdU was injected in pregnant dams at E18.5, and 8 hours later, embryos of indicated genotypes were collected. Cryosections of ascending aortas were stained for EdU, SMA, CD31, and nuclei (DAPI). Proliferative SMCs were marked by EdU+SMA+DAPI+ cells. Lu, lumen. Scale bar: 25 μm. (F) Histogram represents the percentage of SMCs that are proliferative in E. n = 3 mice. **P < 0.01 by 1-way ANOVA with Tukey’s post hoc test. All data are averages ± SD.

