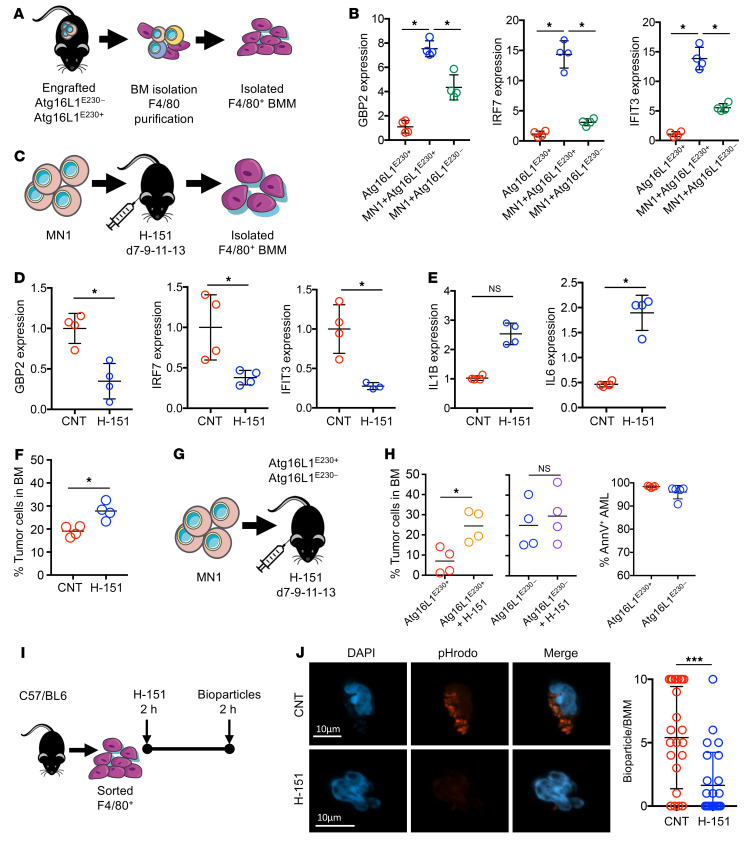
Figure 4. LAP activates STING in BMMs, reducing AML engraftment.
(A) MN1-treated cells or vehicle-treated (PBS) cells (1 × 10⁶) were injected into busulfan-treated Atg16L1E230+ and Atg16L1E230– mice. BMM F4/80+ cells were isolated via magnetic separation, and RNA was extracted for qPCR analysis. (B) Relative gene expression untreated, engrafted Atg16L1E230+, and engrafted Atg16L1E230– isolated BMMs (n = 4 mice). (C) MN1 cells (1 × 10⁶) were injected into busulfan-treated C57/BL6 mice. On days 7, 9, 11, and 13 after injection, mice were injected i.p. with 200 μL H-151 (750 nmol) or vehicle and sacrificed 14 days later. BMMs were sorted and RNA was extracted for analysis by qPCR. (D) Relative gene expression in AAMs from animals engrafted with MN1 cells or MN1 cells treated with H-151. (E) Relative expression of IL1B and IL6 genes (n = 4 mice). (F) BM was extracted, and cells were analyzed by flow cytometry for engraftment on day 14 (n = 4 mice). (G and H) MN1 cells (1 × 10⁶) were injected into busulfan-treated Atg16L1E230+ and Atg16L1E230– mice. On days 7, 9, 11, and 13 after injection, mice were injected i.p. with 200 μL H-151 (750 nmol) or vehicle and sacrificed 14 days later. BM was extracted and cells were analyzed by flow cytometry for engraftment on day 14 (n = 4 mice). (I) Schematic diagram of the experimental design. F4/80+ BMMs from C57/BL6 mice were sorted and cultured with H-151 (10 μM) or vehicle for 2 hours. BMMs were then incubated with pHrodo E. coli bioparticles for 2 hours. (J) Representative microscopy images. Scale bars: 10 μm. Plot shows the quantification of bioparticles (red) per BMM in control and H-151–treated BMMs (n = 25 BMMs). Data indicate the mean ± SD. *P < 0.05 and ***P < 0.001, by Mann-Whitney U test (D–F, H, and J) and Kruskal-Wallis test (B).

